This topic contains the following sections.
A Cognex 3D displacement sensor can return information about three-dimensional objects that cannot be easily generated by cameras that acquire two-dimensional images. A displacement sensor generates a range image, a synthetic 2D image containing height profile information in real-world coordinates.
For example, the following figure shows an illustration of a 3D object and an example of the range image it would generate after passing under a Cognex 3D displacement sensor:

A range image expresses the height profile using greyscale values. The lighter the value of the pixel, the closer the corresponding surface element is to the sensor itself. The dark red pixels in the range image represent missing pixels, or areas of the object that are not visible to the field of view of the sensor as the object passes by.
A range image can be analyzed by other 3D vision tools to generate information about a planar surface, to generate height or volume calculation, or to analyze a cross-section of the object. A range image can also be passed to any number of traditional vision tools to perform tasks such as pattern matching or optical character recognition.
You can visualize the acquired range images in 3D Viewing 3D Range Images with the 3D Viewer or programmatically Adding a 3D Viewer to Your Application.
You can change the displayed appearance of a range image using the Colormap control. You can change the displayed range of heights, the default greyscale representation to a colored one (including standard height, thermal visualization, or any custom color map), and the color of missing pixels.
For information on setting up acquisition with your displacement sensor, see the Getting Started topic. For detailed information on range image acquisition, see the Acquiring Images from a DS900 Series Sensor and Acquiring Images from a DS1000 Series Sensor topics. For advanced range image acquisition details, including coordinate spaces related to range images, see the Range Image Coordinate Spaces and Associated Parameters topic. For hardware-related information (such as mounting and physical product features) and further product details, see the DS900 Quick Reference Guide, DS1000 Quick Reference Guide, and the DS1000 Technical Reference Manual.
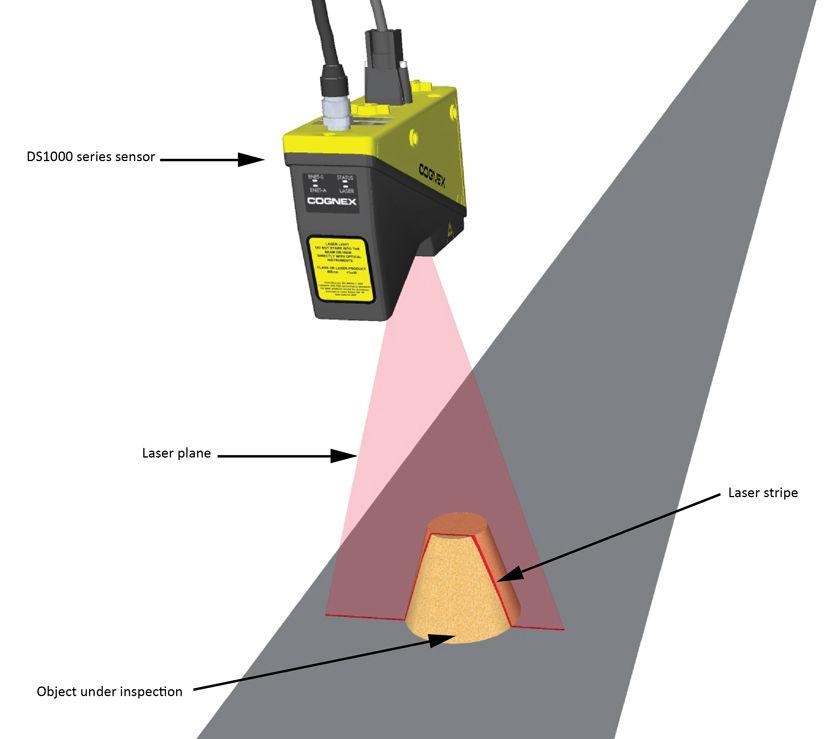
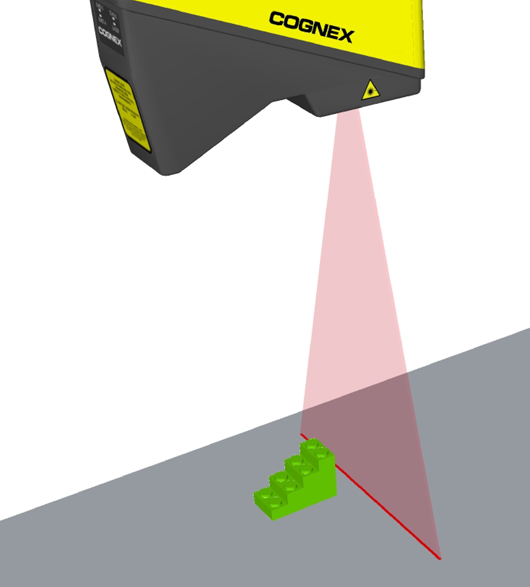
The Cognex 3D displacement sensor projects a triangular laser plane onto the object under inspection, illuminating its surface. The illumination of the laser plane results in a laser stripe whose shape is determined by the surface of the object. The optical axis of the camera integrated into the displacement sensor encloses an acute angle with the laser plane. With the camera looking at the laser plane from the side, the higher a reflecting spot is on the object's surface, the more shifted (higher) it will appear in the laser stripe. Thereby, the shape of the laser stripe provides exact height profile information of the object.
The following figure illustrates this with a truncated conical object under inspection.
The following figure illustrates the laser stripe as seen from the position of the camera (on the left) and the intensity image (on the right), which is the image that the camera sees through its red long-pass filter:

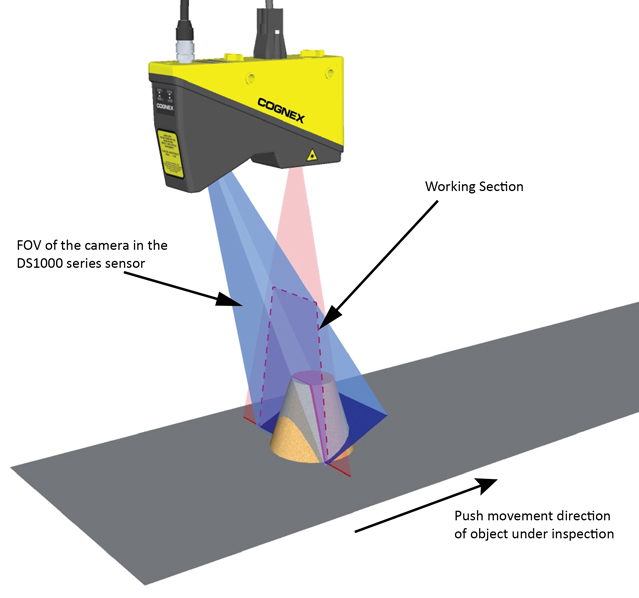
There are variations between units of Cognex 3D displacement sensors; therefore, the Working Section is based on the common portion of Field of View that all units share. The Working Section is an exactly defined area that has the same dimensions for all units. For its exact dimensions, see the Range Image Coordinate Spaces and Associated Parameters topic.
Note: Due to unit-to-unit variations, areas that are outside the Working Section limits may be visible in intensity images; information from these areas is not reflected in the range image. For range image generation, only that portion of the data is used that is obtained from within the Working Section.
Surfaces that are illuminated by the laser plane but that fall outside of the Working Section (for example, being too low in height) appear as hidden areas marked as missing pixels in the range image.
A single laser stripe provides 1D height profile information. Moving the object under the camera through the laser plane and acquiring multiple laser stripe images from the object while moving gives 2D height profile information.
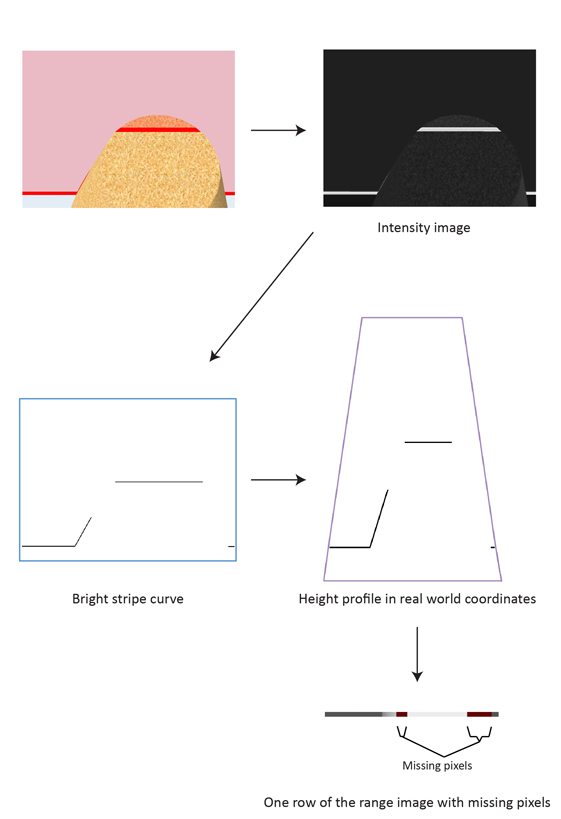
A range image is a synthetic 2D image containing height profile information in real world coordinates. It is generated from a series of acquired intensity images, each row of the range image corresponds to one intensity image. A row of the range image is generated by expressing in greyscale pixel values the calibrated peak data obtained from the intensity image. The raw (uncalibrated) peak data is the result of the bright stripe curve finding operation. Calibration transforms the raw peak data into a pixel space that represents real world coordinates and thereby also removes distortions such as camera lens distortion and perspective distortion.
For information on range image coordinate spaces, see Range Image Coordinate Spaces and Associated Parameters.
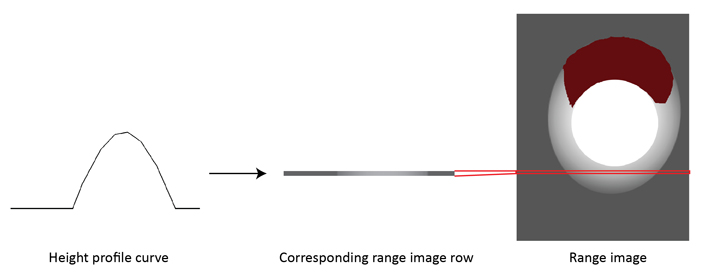
The following diagram depicts the process of range image generation:
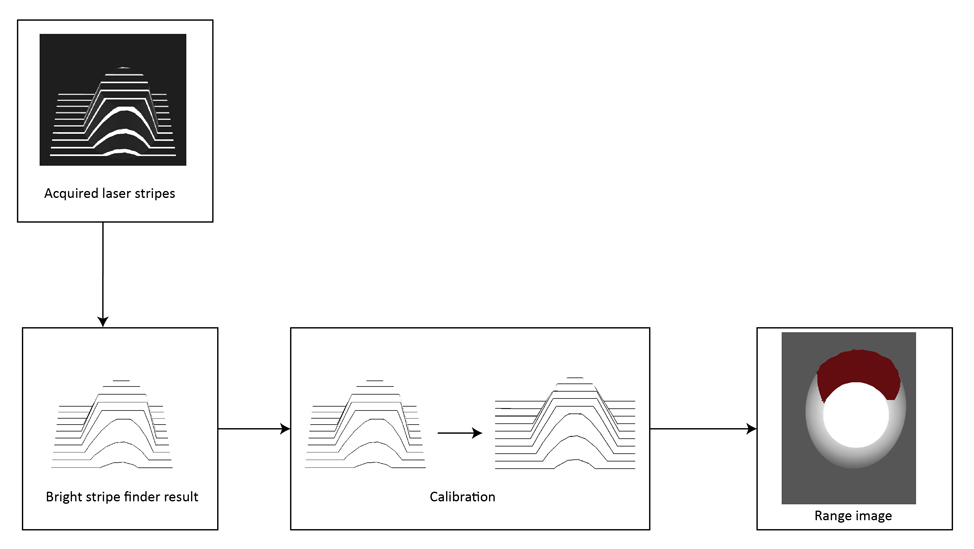
Note: The range image in the diagram above has been generated using more laser stripes than shown above, hence the range image has more rows than the number of the shown laser stripes. Reduced number of laser stripes are shown to illustrate the process in a clearer manner. The range image generation process uses only that portion of the raw peak data that is obtained from within the Working Section.
A laser stripe appearing in the intensity image typically has widths greater than a single pixel (due to the laser plane being of a definite nonzero width and the seen width being dependent on the reflecting material). The Cognex 3D displacement sensor finds the location of the laser stripe in each intensity image column and expresses these height values as the bright stripe curve, which is a discrete curve. The bright stripe curve is the basis of range image generation.
The following figure illustrates an intensity image of a laser stripe and the bright stripe curve expressing its location.

Range images are 2D images containing 3D shape information available in real world coordinates. Range images are compound images consisting of the following parts:
- 16-bit height profile image, a 2D image in which the height profile of the objects passing through the Working Section is expressed in greyscale values. Missing pixels in this image have a value of zero.
- Visible Pixel Mask, identifying which pixels have valid range data. The size of the mask equals the size of the height profile image.
- 3D transform, allowing you to map pixel locations (from the pixel space) to real world coordinates in the Sensor3D space. That is, this 3D transform maps range image (row, column, pixel value) triplets to physical (x, y, z) coordinates in the Sensor3D space.
A row of a range image is generated in two steps:
Calibration in the plane of the Working Section
Transforming the bright stripe curve corresponding to the actual row to a curve that represents the height values in real world coordinates (in the Sensor3D space).
Greyscale representation
Generating range image row pixels by expressing in pixel values the values of the curve that represents the height values in real world coordinates.
An intensity image contains the information on what the built-in camera of the displacement sensor sees. The position of a spot of the laser stripe in the intensity image is determined by the height of the reflecting spot on the object's surface; however, this position information is not expressed in real world coordinates. The relationship between the laser spot's position in the intensity image and the laser spot's position in real world coordinates is influenced by the following:
- Camera lens distortion.
- Geometric distortion determined by the position of the camera relative to the laser plane.
In the theoretical case where: there is no lens distortion, the optical axis of the camera is perpendicular to the laser plane, and the camera is placed far from the laser plane, the brigt stripe curve (created from the intensity image) would be close to a scaled version of the curve that expresses the height values in real world coordinates.
To compensate for camera lens distortion and camera positioning and obtain the height profile in real world coordinates, as part of calibration, the transformation of the bright stripe curve is performed based on calibration data present in each sensor.
The following image shows a spot in the intensity image, on the bright stripe curve, and its position on the curve that expresses the height profile in real world coordinates obtained through calibration.
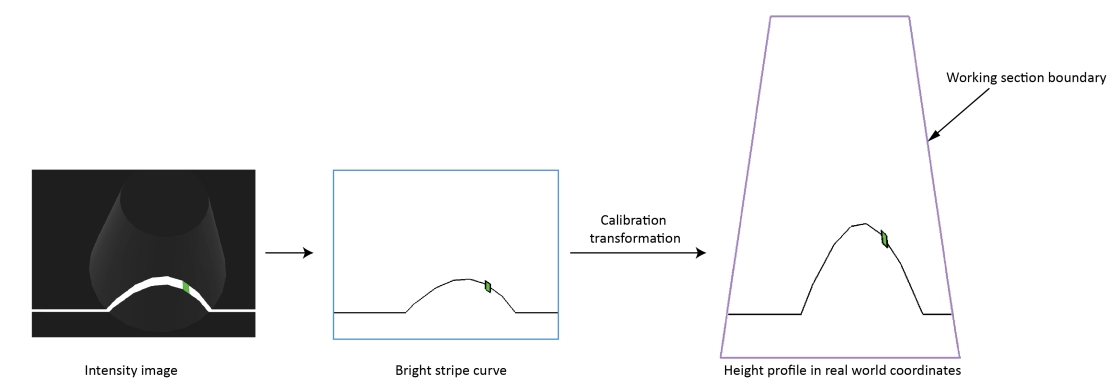
The curve that expresses the height profile in real world coordinates may appear in the trapezoidal Working Section.
Compensation of Perspective
A laser stripe that is situated higher does not only appear higher in the intensity image but also wider because it is closer to the camera. This introduces perspective, that is, view in depth in the raw peak data.
The following figure illustrates the effect of perspective distortion with two laser stripes of the same width.
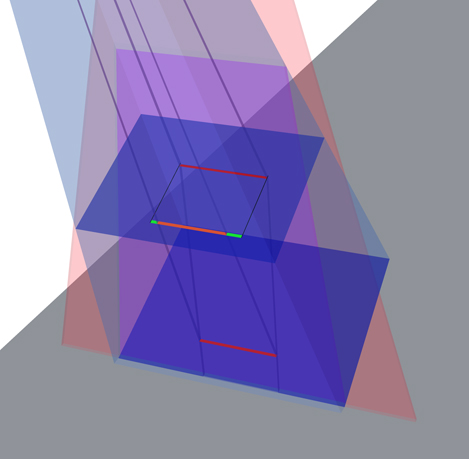
The projected orange colored stripe shows in what width the camera sees the lower laser stripe relative to the higher laser stripe and the green stripe portions show the difference.
Because calibration transforms bright stripe curves into real world coordinates, it effectively eliminates the effects of perspective distortion. A range image, resulting from calibrated height profile data, shows objects of the same width but situated at different heights as being of the same width.
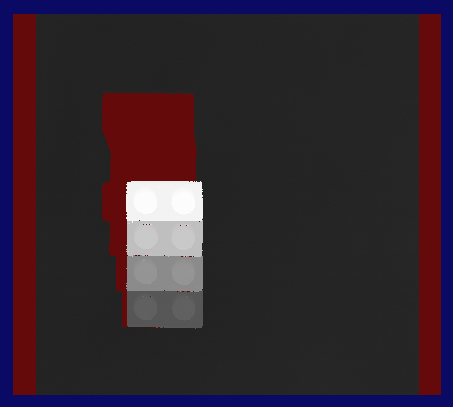
The following images show a LEGO® piece with different heights, but the same width, and the range image generated from it.
A row of a range image is generated by expressing in pixel values the values of the corresponding curve that expresses the height profile in real world coordinates.
The XScale and ZScale parameters are used during range image row generation. XScale is used to determine the number of pixels that should be generated per a unit distance (in mm) of the curve that expresses the height profile in real world coordinates, along the X axis of the Sensor3D space. ZScale is used to determine the pixel values that correspond to given heights (distances along the Z axis of the Sensor3D space).
The pixel values in the height profile image component of the range image are represented on 16 bits, they range from 0 to 65535. The pixel value of 0 in the 16-bit height profile image component of the range image represents missing pixels (meaning “no data”), which represent hidden areas. Missing pixels are marked with the Visible Pixel Mask (as dark red by default).
The vertical size of the range image (that is, the number of rows it has) is determined by the number of acquired laser stripes.
The 3D transform contained in the range image is generated based on the XScale, YScale, and ZScale parameters. Note that while the calibration transformation is nonlinear, the 3D transform is a linear transformation.
Use the 3D transform to map pixel locations from the range image pixel space to real world coordinates in the Sensor3D space. For more information on coordinate spaces, see the Range Image Coordinate Spaces and Associated Parameters topic.
The following limitations apply to range images.
Certain areas of the object under inspection may be hidden from a single Cognex 3D displacement sensor. Such areas lack valid values on the bright stripe curve and/or the curve that expresses the height profile in real world coordinates. By default, the missing values are substituted with a zero by the acquisition system and they are marked as missing pixels in the Visible Pixel Mask. Such areas are displayed with dark red color (by default) when viewing the range image on the display. In the 16-bit height profile image component of the range image, they appear as black shadows.
The following two types of occlusion may cause missing pixels. VisionPro provides the Missing Pixel operator of the One Image Edit Control to replace missing pixels by estimated or interpolated values.
Laser Blocked by the Object
The laser may be blocked by the object under inspection. The following image depicts such a scenario with a cubical object entering the Working Section. The direction of the laser beams is marked with arrows.

The areas not illuminated by the laser and hence not seen by the camera (because the camera detects the laser stripe) will not appear in the intensity and range images. The parts of the curve that express the height profile in real world coordinates that correspond to such areas will contain horizontal gaps.
The following figure shows the scenario from the viewpoint of the camera.

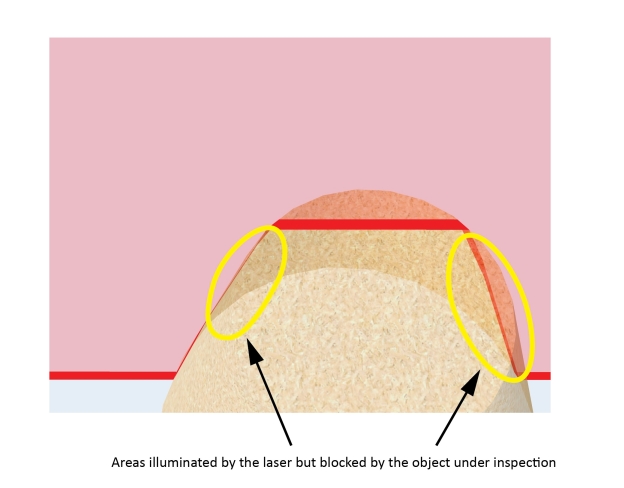
Illuminated Area Blocked by the Object
Even if an area is illuminated by the laser, it may be blocked by the object under inspection. Such areas will be undetected and there will be horizontal gaps in the corresponding parts of the curve that expresses the height profile in real world coordinates.
In the following figure, the same object is under inspection as previously; however, in a different position. As it moved forward, it covered some parts of itself from the camera. The object is shown translucent to show its area that is illuminated but that is covered from the camera.

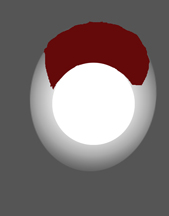
In the following figure, the previous truncated conical object is shown as its rear portions are inspected. The object is shown translucent to show its areas that are illuminated but that are covered from the camera.
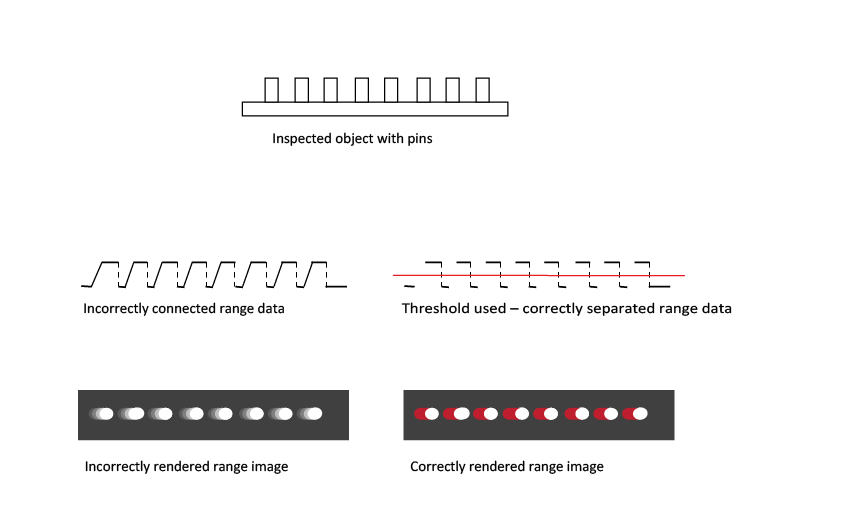
The height profile data is a set of discrete points. To generate the range image pixels, adjacent points (points that are close to each other) are connected and the appropriate greyscale values (based on the heights) are assigned to these connecting sections. That is, interpolation is performed between adjacent points to generate the range image pixels.
Two adjacent points get always connected unless:- The height difference between the two adjacent points is too big. The threshold beyond which points are disconnected is predefined for each DS type. OR
- The height difference between the two adjacent points is greater than ZContinuityThreshold which you specify in mm. This threshold is not enabled by default, you must enable it so that it takes effect.
This section contains the following subsections.
This section describes the CogImage16Range class associated with range images acquired from a Cognex 3D displacement sensor.
The CogImage16Range class contains the following information about the range image:
- The acquired height data, represented as a CogImage16Grey image, where the height for a pixel is represented by its pixel value.
- The Visible Pixel Mask data, represented as a CogImage8Grey image, where pixels of zero value mark missing pixels and pixels of value 255 mark visible pixels in the height data.
- The transforms, each represented as an ICog3DTransform, that map the locations of pixels from the pixel space to the physical spaces. The physical spaces are included in the range image's 3D coordinate space tree; they include the Sensor3D space and any other custom physical space you define.
The following tools operate directly on range images:
- Range Image Display
- Range Image Height Calculator Tool
- Range Image Plane Estimator Tool
- Range Image Volume Calculator Tool
- Range Image Cross Section Tool
- Median NxM operator of the One Image Tool
- Missing Pixel operator of the One Image Tool
- CogFixture Tool
Range Image Display
To display range images, you simply supply a CogImage16Range image to the Image property of a CogDisplay control.
Range Image Height Calculator Tool
The Cog3DRangeImageHeightCalculator calculates the height of a surface defined by the range image pixels in a 2D region relative to a base plane. This tool also outputs diagnostics data about how the range image pixels were used to calculate the height.
Range Image Plane Estimator Tool
The Cog3DRangeImagePlaneEstimatorTool finds the best fitting plane to a surface in a range image. This tool also outputs the tilt and rotation of the estimated plane.
Range Image Volume Calculator Tool
The Cog3DRangeImageVolumeCalculator calculates the volume defined by the range image pixels in a 2D region based on a reference base plane. This tool also outputs diagnostics data about how the range image pixels were used to calculate the volume.
Range Image Cross Section Tool
The Cog3DRangeImageCrossSectionTool creates the profile along a cross section of a range image, based on the range image pixels in a thin 2D region. It allows measurements on the profile data using operators.
Median NxM Operator of the One Image Tool
The CogIPOneImageMedianNxM operator accepts and filters range images.
Missing Pixel operator of the One Image Tool
The CogIPOneImageMissingPixel operator accepts range images and substitutes the pixels marked as missing with pixels whose values are based on the analysis of the surrounding pixels.
CogFixture Tool
The CogFixtureTool accepts range images and attaches a fixtured coordinate space to it.
The following transform types exist:
-
Transforms mapping between physical spaces (Sensor3D Space and Sensor2D Space for example) and image spaces (pixel space and root space).
- To map 3D points, use a 3D transform that defines the relationship between a pixel row, pixel column, and pixel value (treated as a z-coordinate) triplet and the x, y, z coordinates of the corresponding point in the physical 3D space. Such a 3D transform is represented as an ICog3DTransform.
- To map 2D points, use a 2D transform that defines the relationship between a pixel row, pixel column pair and the x, y coordinates of the corresponding point in the physical 2D space. Such a 2D transform is represented as an ICogTransform2D.
- Transforms mapping between the root space and the pixel space. Transforms for 2D points and 3D points are both available. See the PixelFromRootTransform and PixelFromRootTransform3D properties, discussed below.
The following commonly used objects are associated with the 3D and 2D transforms:
- The GetTransform3D method returns an ICog3DTransform that maps three dimensional points from the 'From' space to the 'To' space. Space names refer to 3D space names, not 2D space names. You can use this method to obtain transforms that map between spaces included in the range image's 3D coordinate space tree, or between the pixel space "#" and any space in the range image's 3D coordinate space tree. The special string "." is accepted as an alias for the SelectedSpaceName3D of this image. Pixel space "#" and root space "@" are recognized. It is the 3D analog of the 2D GetTransform method.
- Cog3DCoordinateSpaceTree's GetTransform method returns an ICog3DTransform that maps three dimensional points from the 'From' space to the 'To' space where the 'From' and 'To' spaces are both included in the range image's 3D coordinate space tree. See more in the documentation of the Cog3DCoordinateSpaceTree class.
- The SelectedSpaceName3D property defines the name of the three dimensional coordinate space to be used by tools that process this image. The CogImage16Range is default constructed with this property set to "Sensor3D". It is the 3D analog of the 2D SelectedSpaceName property.
- The MapPoint2DFrom3D method maps the supplied three dimensional point into the specified two dimensional space. This is allowed by the CogImage16Range holding both 2D and 3D coordinate space transform information.
The MapPoint3DFrom2D method maps the supplied two dimensional point into the specified three dimensional space. This is allowed by the CogImage16Range holding both 2D and 3D coordinate space transform information.
For handling missing pixels, this method has the “Visible” output argument. If this value is not true, that means that no meaningful mapping could be performed for the supplied pixel space coordinates, indicating a missing pixel, and so the output 3D point should not be used.
Also, you can use the PixelFromRootTransform3D property, which defines the 3D transform mapping to the 3D root space from the pixel space. It is the 3D analog of the 2D PixelFromRootTransform property. The PixelFromRootTransform property is the two dimensional subset of the PixelFromRootTransform3D property.
Note: You cannot set PixelFromRootTransform directly due to the unique nature of CogImage16Range. If you want to set it, you must set it through setting the PixelFromRootTransform3D property.