This topic contains the following sections.
This section describes a Cognex 3D displacement sensor application that is used to measure the height of products. The height measurement results can be used to provide various statistical information about the height variety of products in bulk or to measure the height of individual products to see whether they fall in an acceptable range.
For the theory of range images, acquired from displacement sensors, see the Working with 3D Range Images topic. For information on setting up acquisition with your displacement sensor, see the Getting Started topic. For detailed information on range image acquisition, see the Acquiring Images from a DS900 Series Sensor and Acquiring Images from a DS1000 Series Sensor topics. For advanced range image acquisition details, including coordinate spaces related to range images, see the Range Image Coordinate Spaces and Associated Parameters topic. For hardware-related information (such as mounting and physical product features) and further product details, see the DS900 Quick Reference Guide, DS1000 Quick Reference Guide, and the DS1000 Technical Reference Manual.
In short, you will need to do the following:
- Set the image source.
- Specify the base plane.
- Specify the height measurement region.
- Fine-tune the results.
| If there is no alignment being done (as in this QuickBuild example) then the part must be in precisely the same location every time an image is acquired. This is normally not the case and alignment is highly recommended before doing height measurements. Otherwise part(s) of the object might be in the area for the base plane estimation or the area for the height estimation might include undesired features with different heights. |
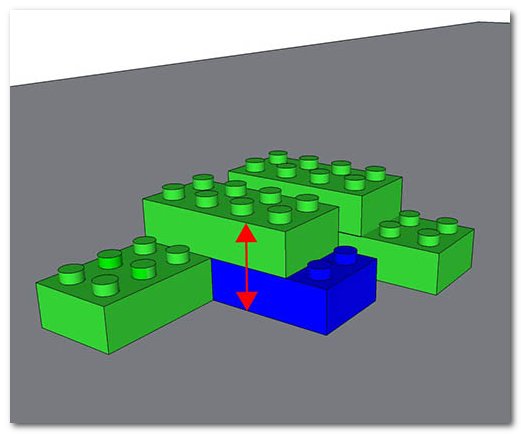
To use the Height Calculator tool on a range image, you will need to provide a base plane, relative to which you would like to measure the height of a feature. The simplest example is an object travelling on a conveyor belt where you would like the conveyor belt to be the base plane. This application uses the Plane Estimator Tool to define the base plane. Once that is done, you need to define a region in the Height Calculator tool where the height measuring happens.
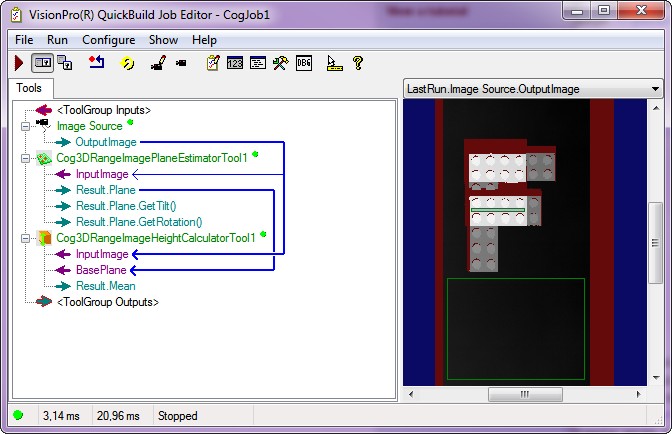
Configure the Job's Image Source to acquire images from a sensor or from an image database containing range images. You can apply colormap on the image(s) if that is necessary.
Add and connect a Cog3DRangeImagePlaneEstimatorTool to the Image Source.
Add and connect a Cog3DRangeImageHeightCalculatorTool to the Image Source.
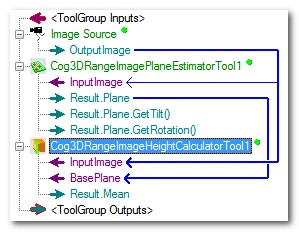 Figure 2: Conveyor belt as the base plane
Open the Plane Estimator Tool and acquire a range image about the object that you want to inspect.
Define a base plane. For information on defining the base plane with the Plane Estimator Tool, see the Using the Plane Estimator Tool topic. This example below uses the conveyor belt as the base plane, marked by the blue rectangle.
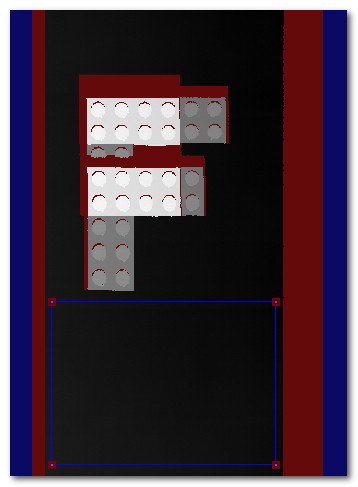 Figure 3: Conveyor belt as the base plane
Open the Height Calculator Tool. This tool gets the same image for input image as the Plane Estimator Tool.
To define and place the region where you would like to measure the height of a feature on the range image, go to the Region tab. By default, the entire range image is used.
- Set the Region Mode; if you have a mask, set it to Pixel Aligned Bounding Box Adjust Mask.
- Set the Plane Side. For more information, see Specifying which plane side is above the plane.
- Select a Region Shape according to what fits best for the measurement.
- Select the image space. Usually this is the input image space, but you can select the root space (the coordinate space of the acquired image before any image processing) and the pixel space (pixels as units) as well.
- Select the mode in which the measurement region is generated on the range image (coordinates at the center or the origin of it). The Fit In Image button puts the region back to the center of the range image.
 Note
NoteSelecting an area for height calculation that is located on or very close to an object edge might lead to measuring errors. 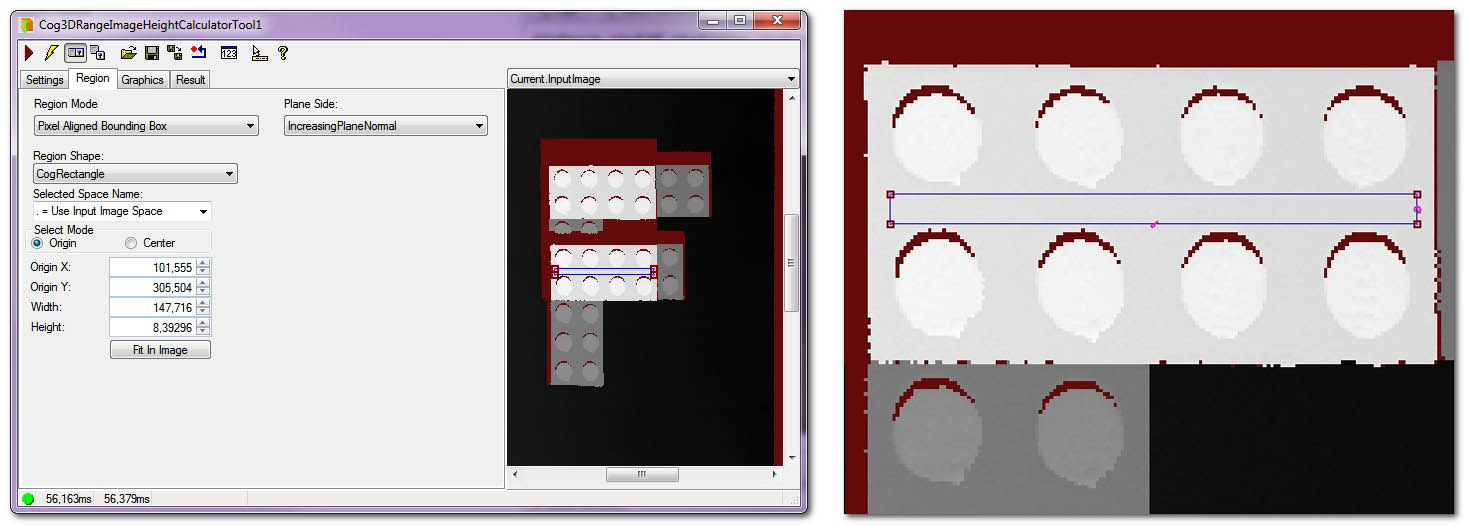 Figure 4: The Height Tool Measurement Region Settings And The Zoomed Region
To fine-tune the results, go to the Settings tab.
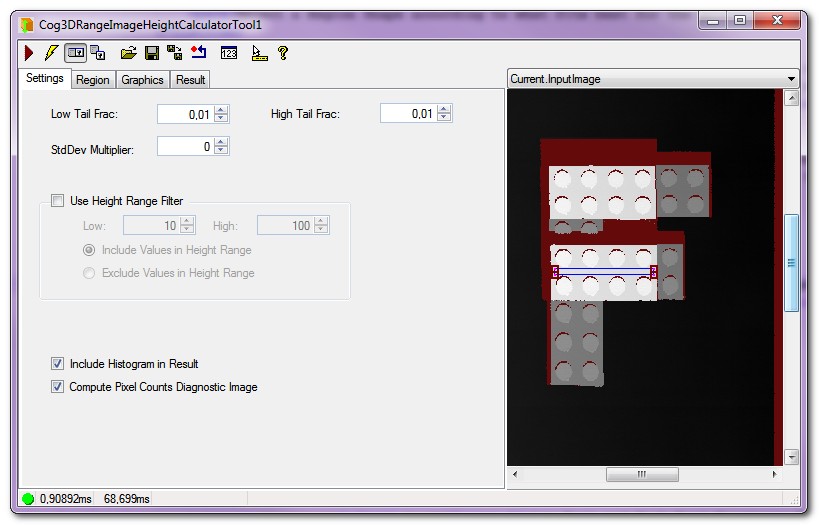 Figure 5: Settings
The HighTailFrac and LowTailFrac values can help you filter the noise by discarding the defined percentage of the highest and/or the lowest pixels. See Figure 6 on the effect of changing these values. In the picture, you can see a histogram with the distribution of pixels with height values. A great number of pixels is of the same (or very nearly the same) height while a little fraction of them are on the extremities and are higher or lower then the average. As we are speaking of a plain base plane and a plain height measurement region in this case (Figure 1), the deviation is not that much, but these tenths of millimeters could suggest that the conveyor belt on which the object is lying, is not perfectly plain. As we increase the rate of the low and high tail fractions, more and more pixels will be discarded from the two ends of the histogram, leaving those behind that have values closer to the real height of the object (and are present in the greatest number of pixels).
 Figure 6: Low Tail and High Tail Fractions Excluding the Extremities
The StdDevMult Multiplier can help you in making statistical observations about the range image data.
Both the tailFraction and the StdDevMult methods let you discard the highest and lowest pixels. The StdDevMult method will produce different results than the tailFraction method as the shape of the distribution of the height values changes. Both methods will tend to produce more stable (consistent) and robust (not changed by spurious peaks or dropouts) measurements then using the mean or the minimum or maximum height.
Run the tool and view the results on the Results tab.
The tool returns the Mean, the Median, the Minimum, the Maximum, the LowTail, the HighTail and the MeanPlusStdDevMult results.
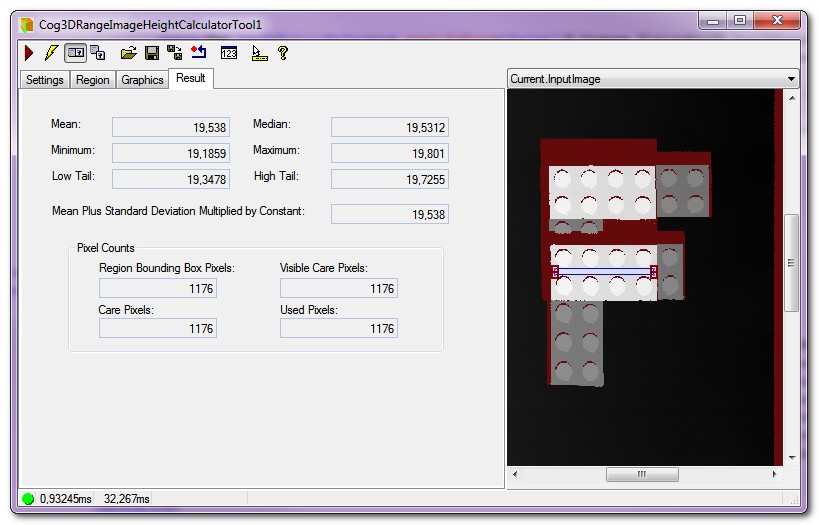 Figure 7: Results