This topic contains the following sections.
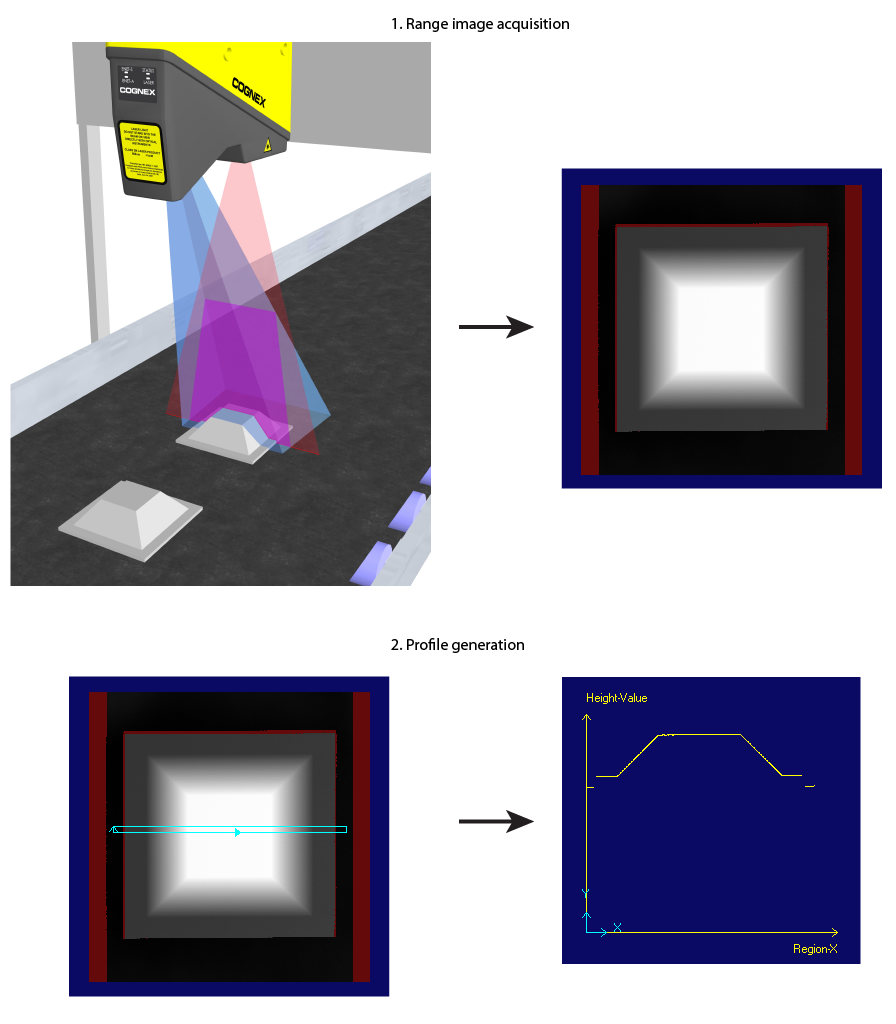
The Cog3DRangeImageCrossSectionTool creates the profile of a range image portion by taking a thin slice of the range image (acquired from a Cognex 3D displacement sensor). The slice is defined by an affine rectangle Region. The tool allows you to look at the profile from the side and perform various measurements on it using operators. The profile is cut parallel to the Z-axis of the range image. The tool returns a Cog3DRangeImageCrossSectionProfile object containing the profile data. It also returns the results of your measurements included in the operators that you use to perform the measurements and the overall status of executing all operators. Note that the tool does not produce a separate result object containing measurement results.
The following figure outlines the steps of profile generation.
The operators for the profile include:
- Extract
- Line segment (Cog3DRangeImageCrossSectionExtractLineSegment) - extracting a line segment within a region you specify.
- Point (Cog3DRangeImageCrossSectionExtractPoint) - extracting a point within a region you specify.
- Corner (Cog3DRangeImageCrossSectionExtractCorner) - extracting a corner within a region you specify.
- CircleFit (Cog3DRangeImageCrossSectionExtractCircleFit) - fitting a circle on the points of a region you specify.
- Compute
- Intersection of two lines (Cog3DRangeImageCrossSectionIntersectLineLine)
- Point on a line segment (Cog3DRangeImageCrossSectionPointLineSegment)
- Middle point between two points (Cog3DRangeImageCrossSectionMidpointPointPoint)
- Line segment between two points (Cog3DRangeImageCrossSectionLineSegmentPointPoint)
- Nearest point to line or line segment from a point (Cog3DRangeImageCrossSectionNearestPoint)
- A single point of interest from the area measurement result object (Cog3DRangeImageCrossSectionPointAreaResult)
- Using the circle center point in downstream calculations (Cog3DRangeImageCrossSectionPointCircle)
- Measure
- Angle between two lines (Cog3DRangeImageCrossSectionAngleLineLine)
- Distance between two points (Cog3DRangeImageCrossSectionDistancePointPoint)
- Distance between a point and a line or between a point and a line segment (Cog3DRangeImageCrossSectionDistancePointLine)
- Measure the area between the profile of a cross-section and one or more line segments (Cog3DRangeImageCrossSectionAreaLineSegments)
- Fixturing the profile: adding a user-defined space to the profile space tree in the output profile (optional).
- Running the operators. The operators are run in the resulting profile space. The operators interpret their regions in that space and produce results in that space.
For the theory of range images, acquired from displacement sensors, see the Working with 3D Range Images topic. For information on setting up acquisition with your displacement sensor, see the Getting Started topic. For detailed information on range image acquisition, see the Acquiring Images from a DS900 Series Sensor and Acquiring Images from a DS1000 Series Sensor topics. For advanced range image acquisition details, including coordinate spaces related to range images, see the Range Image Coordinate Spaces and Associated Parameters topic. For hardware-related information (such as mounting and physical product features) and further product details, see the DS900 Quick Reference Guide, DS1000 Quick Reference Guide, and the DS1000 Technical Reference Manual.
The following example demonstrates profile extraction from a range image and performing measurements on the profile. The geometry of a frustum is measured: the angle of its pyramidal sides and the height difference between its top and rim are measured. The height difference between its top and rim is measured in a separate Cog3DRangeImageCrossSectionTool instance using profile sharing.
Perform the following to extract the profile from a range image and perform the above measurements on it:- Configure the Job's Image Source to acquire images from a Cognex 3D displacement sensor or from an image database containing range images.
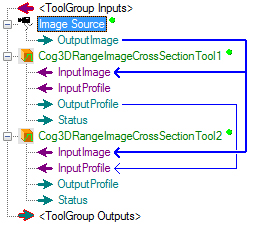
- Add to the job and connect to the Image Source two Cog3DRangeImageCrossSectionTool instances.
Connect the output profile of the first instance to the input profile terminal of the second instance. Note: Even though the input profile you pass to the second instance contains all data you need to perform measurements on it, you must still wire the range image from which you extracted the profile to the second instance to enable fitting its measurement results back on the range image.
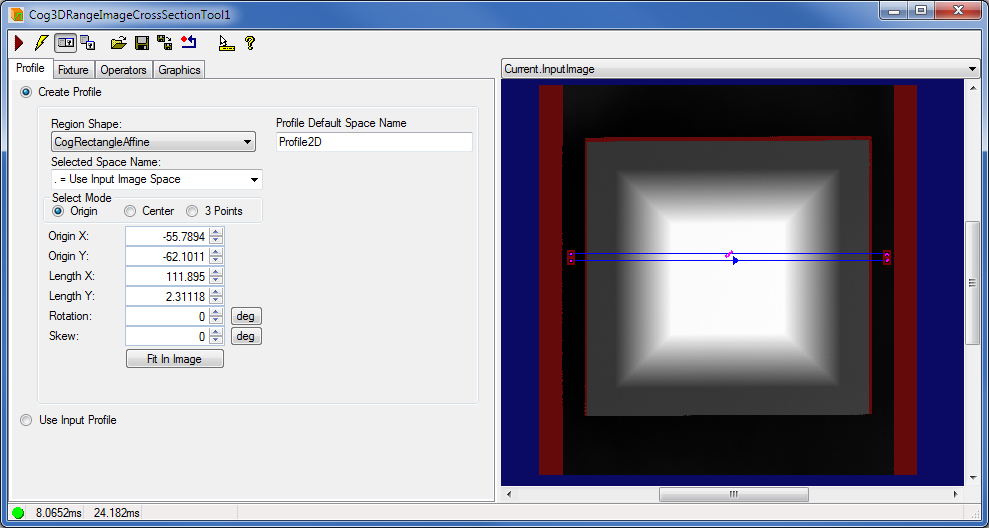
- Acquire a range image about the object that you want to inspect, in this case a frustum, open the first Cog3DRangeImageCrossSectionTool instance and make sure the range image portion from which you want to extract the profile is in your field of view on the display. Apply Colormap if necessary to better see the portion of the range image that you want to inspect.
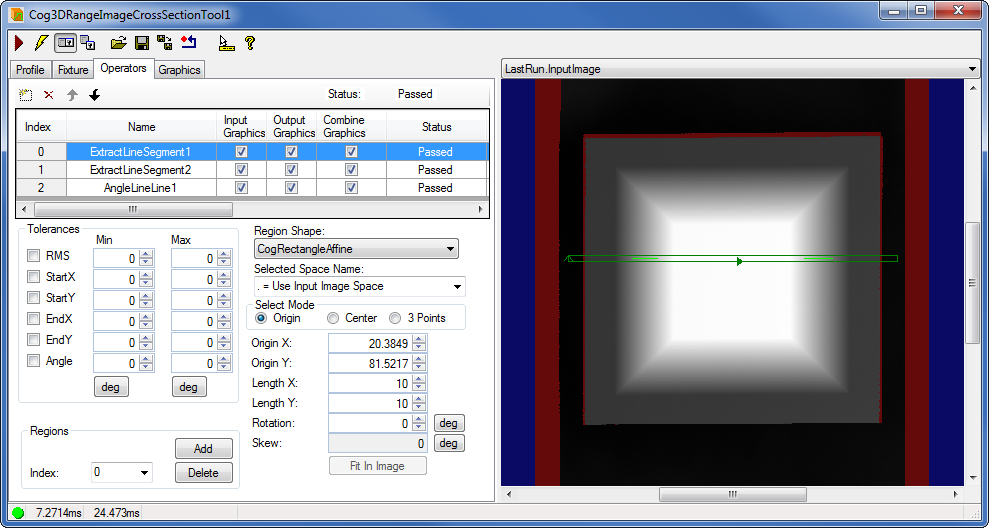
- Specify the Region based on which the profile should be created. Specify the region as an affine rectangle either using the mouse (defining its location, size and angles of skew and rotation) or numerically (using the region parameters). See more regarding affine rectangle regions and their parameters in the Specifying the Caliper Input Region topic.
Specifying a thicker region helps suppress noise in the range image.
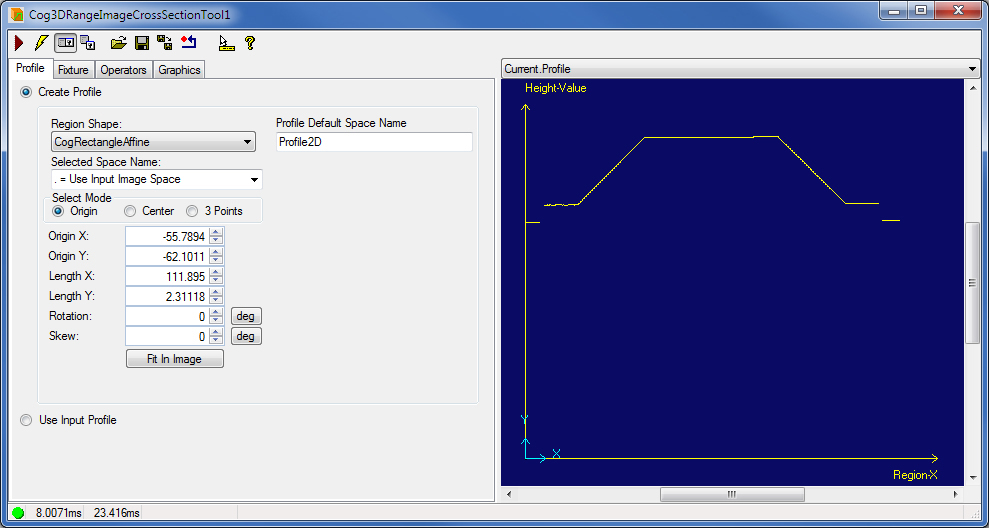
- Run the tool on your selected range image, observe the resulting profile.
- Configure the operators for your measurements on the Operators tab. You configure the feature extracting operators by placing an affine rectangle covering the area where you expect the feature to appear. Computing and measurement operators work based on these extracted features. Using the compute operators, you can compute features based on other features, such as information on the relative position of two other features. Operators are executed in the order they are listed, specified by their Index. You can pass the result of one operator as an input to another operator with a greater Index.
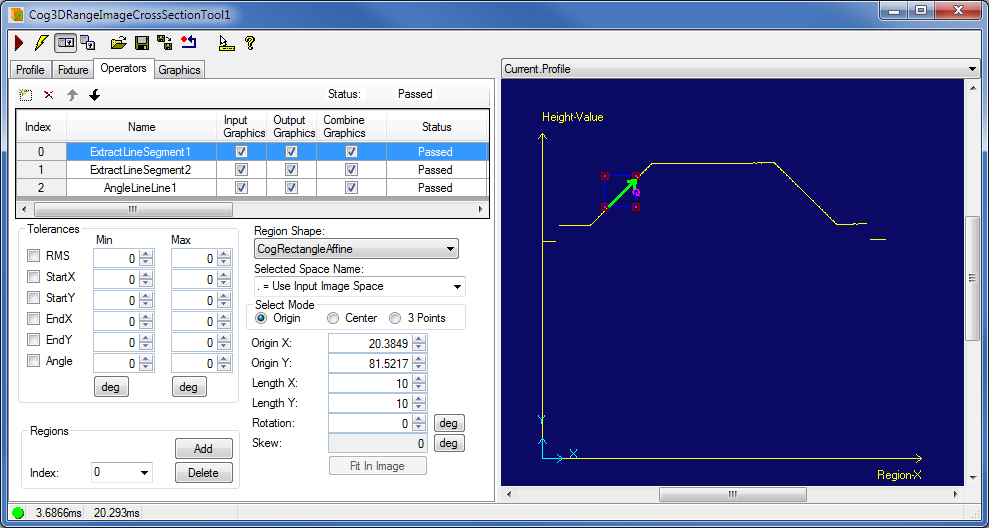
Specifying a line to be extracted:
Specifying the angle to be measured:
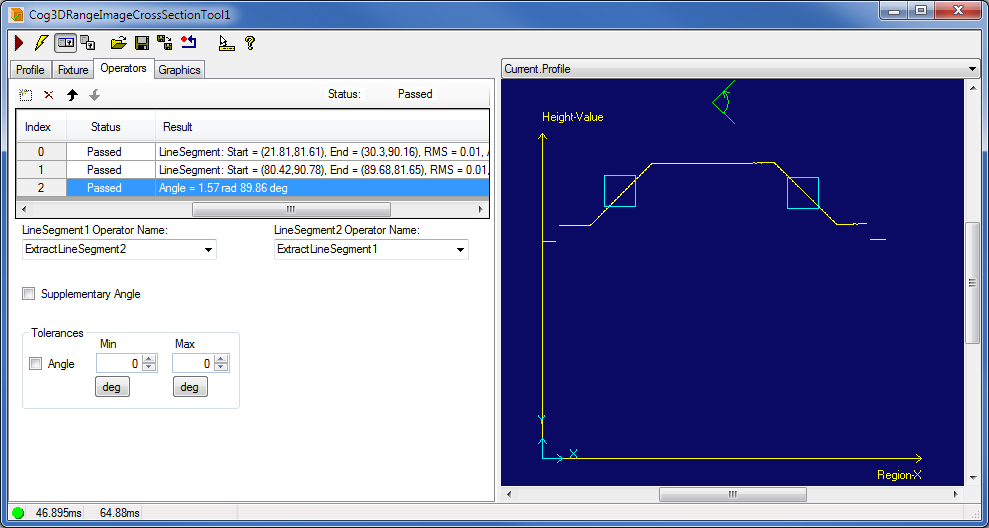
 Run the tool again and observe your measurement results contained in the operators you configured. The results of a measurement operator include the measured property of the found and analyzed features and a status that indicates whether the features have been found and whether they were within the tolerances you can specify. In this case the angle is measured of the two line segments, extracted from the profile, that represent the pyramidal sides of the frustum. The angle has been found to be 89.86 degrees.
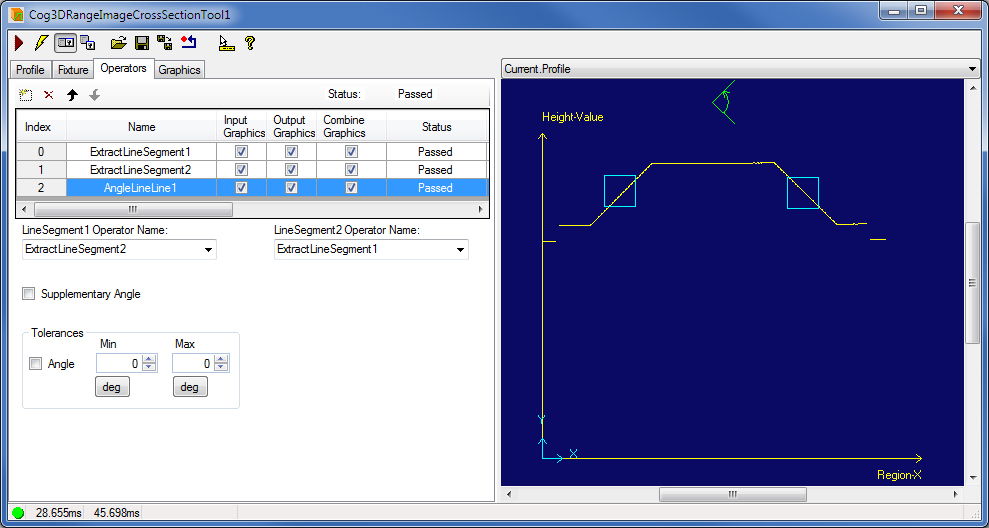
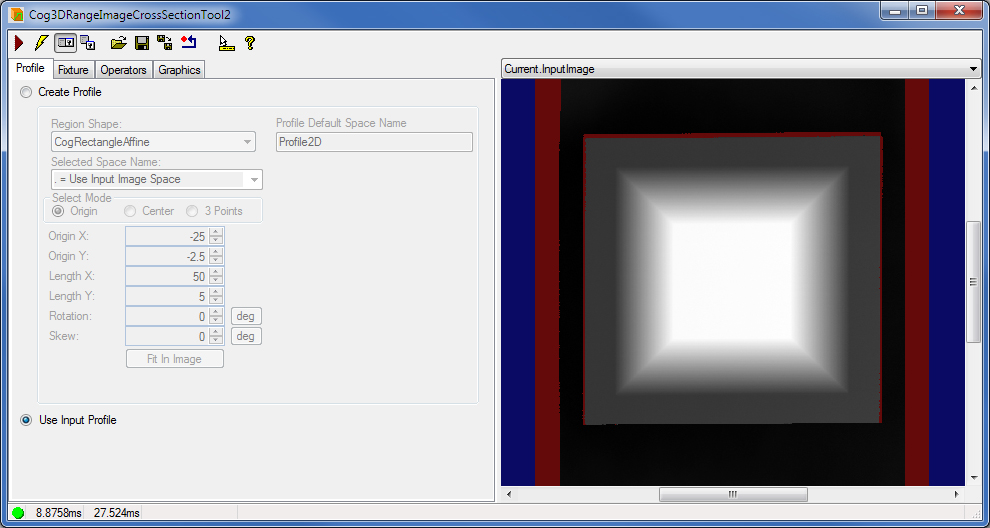
- Open the second Cog3DRangeImageCrossSectionTool instance. On the Profile tab, configure it to accept the profile extracted by the first Cog3DRangeImageCrossSectionTool instance (profile sharing). In this configuration, the second Cog3DRangeImageCrossSectionTool instance will not extract the profile to work based upon, which saves processing time.
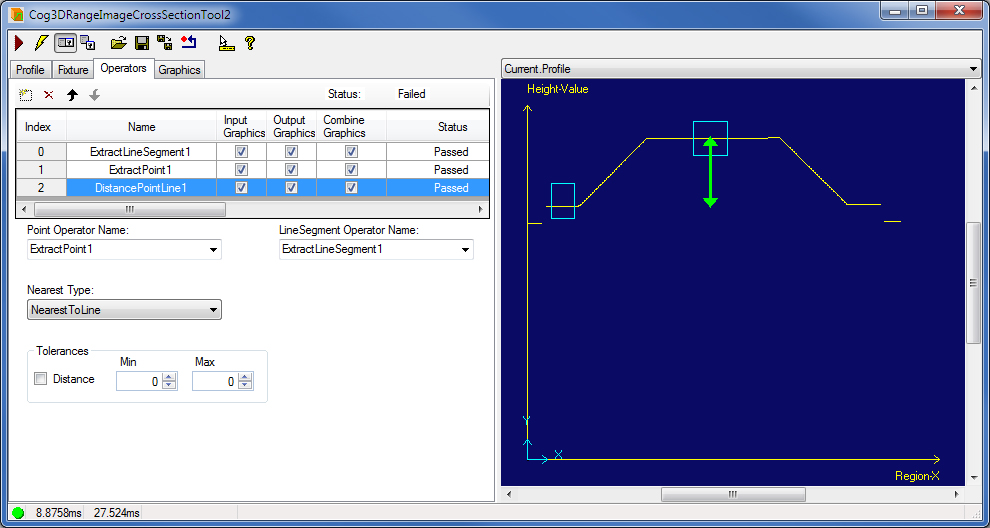
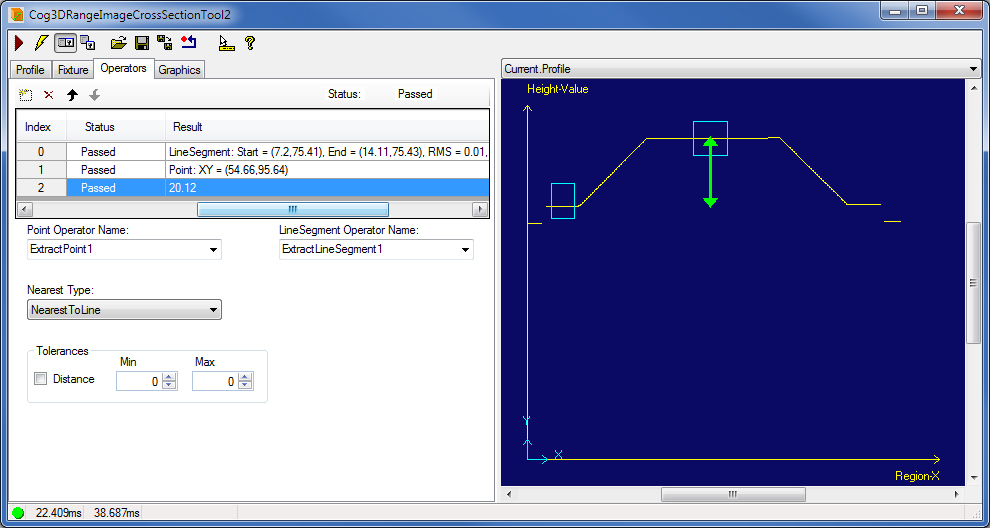
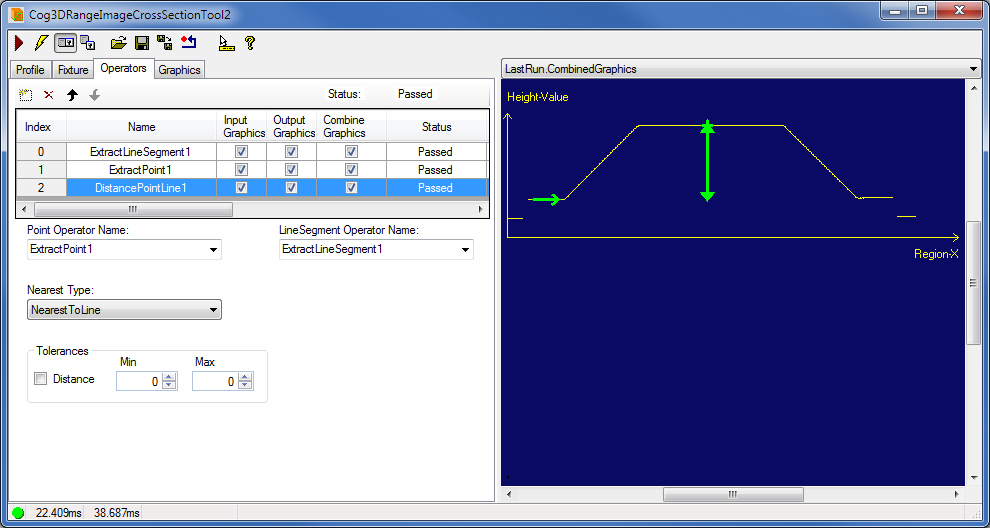
- Configure the operators for the second Cog3DRangeImageCrossSectionTool instance to measure the distance between the frustum's rim (extracted as a line segment) and top (extracted as a point).
The distance has been found to be 20.12 mm.
If the positions of the objects you want to inspect vary, use fixturing.
Fixturing the Range Image
To make sure you are viewing the profile of the same portion of each object to be inspected, it is recommended that you fixture the range image projection region based on which the profile is created. You can fixture a region in the range image by using the CogFixtureTool. First, you have to extract the 16-bit image component of the range image and convert it to 8-bit using a CogPixelMapTool, and then pass the resulting image to the CogPMAlignTool for alignment.
Fixturing the Profile
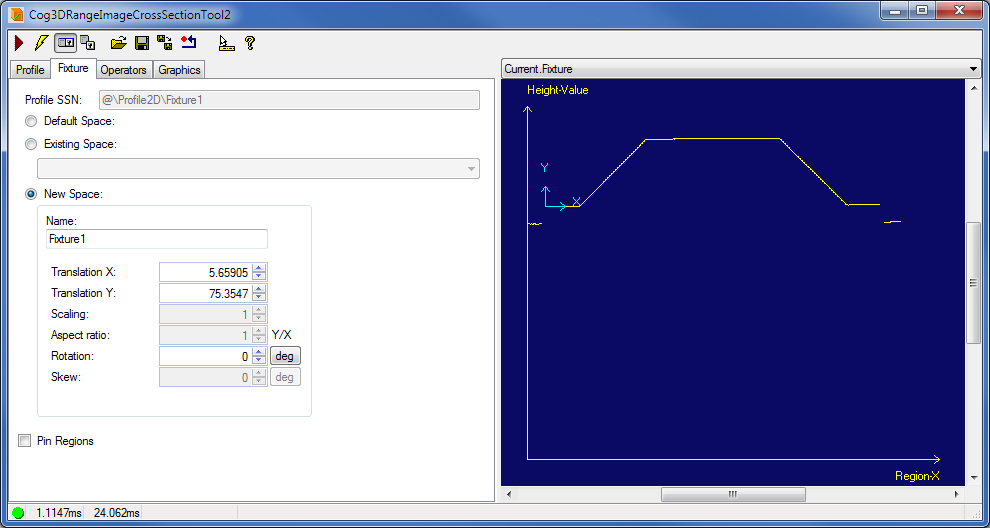
You can change the profile coordinate space to a coordinate space that better suits your application than the default Profile2D space. The profile data will be expressed in the profile coordinate space you specify. You can, for example, fixture your profile coordinate space to a known feature within the profile. You can extract that specific feature from the profile using another Cog3DRangeImageCrossSectionTool and pass its location information to your original tool. That location information can be the origin of your new profile coordinate space. You can set your profile coordinate space on the Fixture tab. Manually, you can adjust your profile coordinate space in the Current.Fixture record.
You can pin the profile regions specified in the operators to their current location while you are changing the profile space selection or the new space transform by setting PinRegions to True. The profile regions with the default selected space name equal to "." will be updated. The profile regions with any other selected space name will not be pinned, updated, or modified. The PinRegions applies only during the setup of the Cross Section tool, it is ignored at runtime. This property is only used by the control; the programmatic interface ignores this property. This option must be checked before specifying the new space if operators exist already.
The following figure shows the results of the operators in the new fixtured profile space, while the regions were pinned during fixture setup.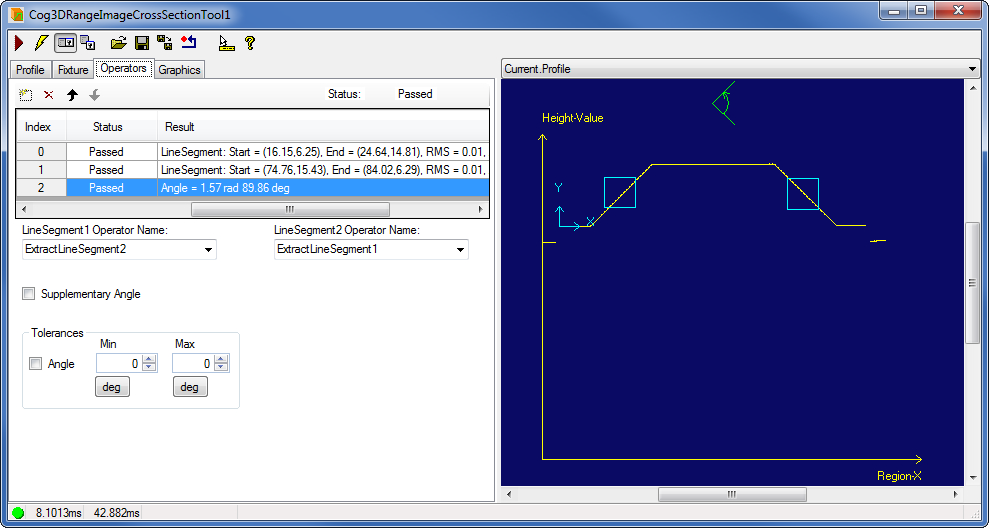
In addition to displaying the results of the operators in the Current.Profile record, results such as points and line segments are also displayed mapped back on the input range image.

Measurements are not mapped back to the range image.
The Cog3DRangeImageCrossSectionTool also displays the results in a convenient way in the LastRun.CombinedGraphics record, which combines and displays all results with the Region-X axis position adjusted to be near your profile contour features.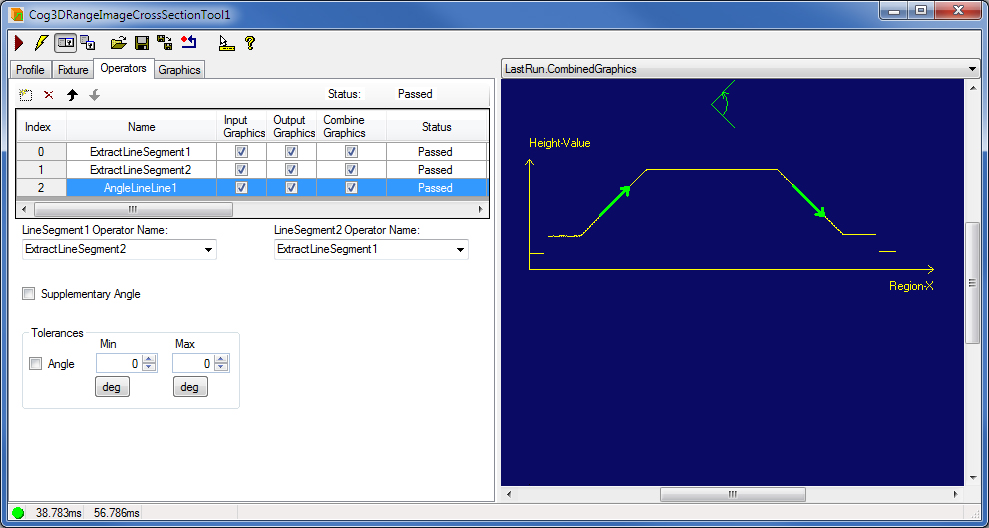
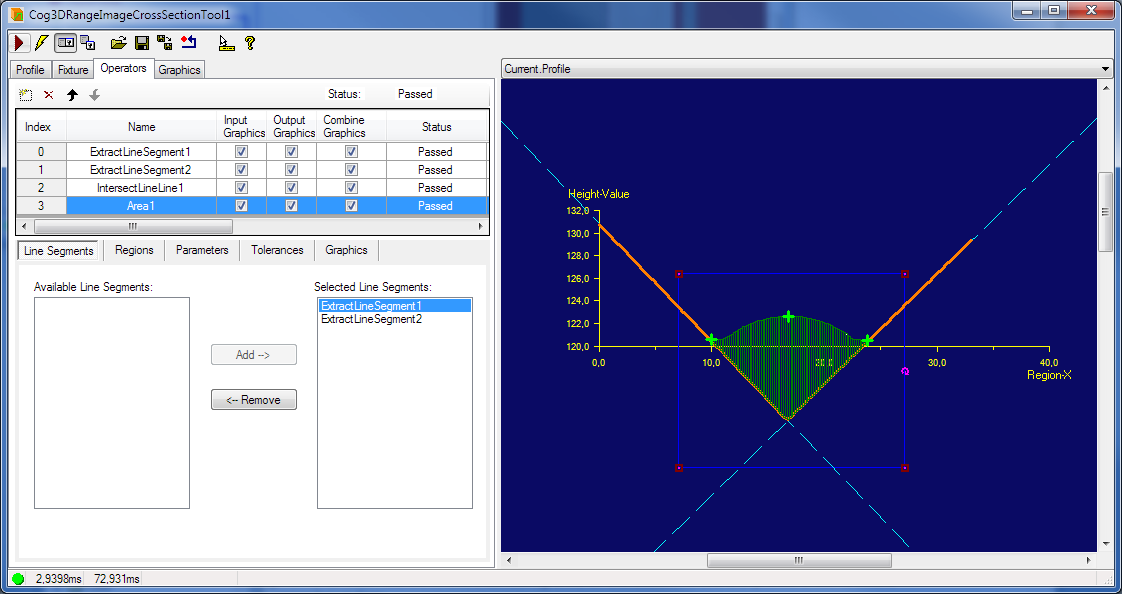
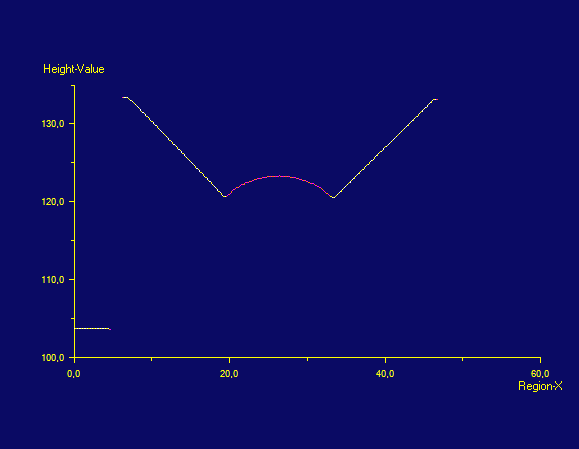
The following example demonstrates profile extraction from a range image and performing measurements on the profile. The subject is a V-channel and the cross-section profile of it looks like this:
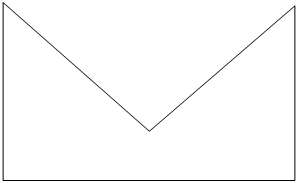
We can measure different things related to this, for example its capacity.
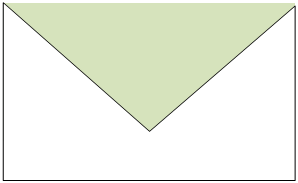
It can be filled with different materials as well (like glue).
With area measurement, we can answer the following questions:
- What is the capacity of the V-channel?
- How much glue is in it?
- What is the remaining area?
- Does it have too much glue in it?
- Does it have enough glue in it?
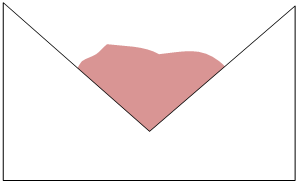
When this V-channel is filled with something, we get the following cross-section profile:
Since the lower part is filled with glue, that part is not visible for the camera and the Cross Section Tool could not extract that part. But we know that the V-Channel is perfectly manufactured and the sides are straight lines and we know where the imaginary continuation of the sides intersect that would be the bottom of the V-Channel. So basically we can reconstruct the V-Channel's profile from the visible pieces and we have the profile of the filling, so we have all the information to measure the area of the filling.
Add two operators to extract line segments and we could use those line segments as boundaries of the interesting area at the bottom while the profile's curve could be the upper boundary. In general, the new Area operator will measure the area between:
- The profile of a cross-section and
- One or more line segments
The line segments will be interpreted as infinite lines and these infinite lines will make up a new reference profile and we can measure the difference between these two profiles.
The user can specify whether the curves that represent the threshold (HeightThreshold) above and below the reference profile should be displayed or not (by default it is not displayed). If the user chooses to display them, they will be drawn with white dashed lines. In the case of very small threshold value it will be necessary to zoom in to see them.
With MaxFillLength, the user can determine the maximum length along the X-axis the Cross Section Tool is supposed to fill. Intervals greater than this value will not be considered as part of the area to be measured.
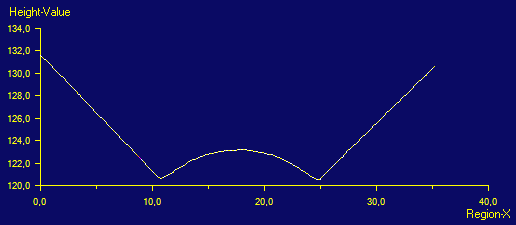
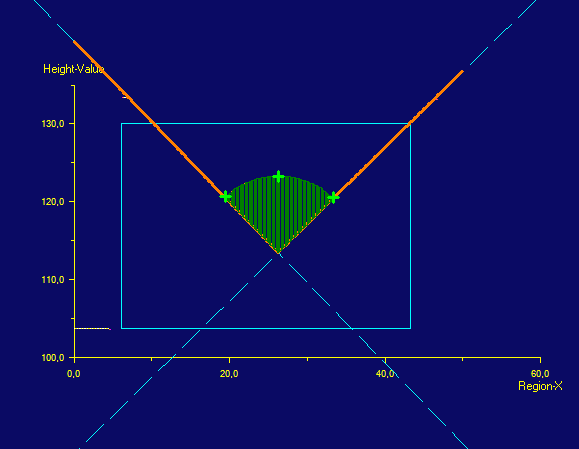
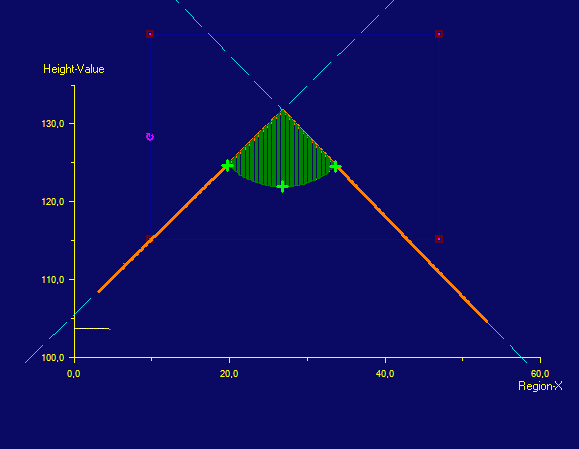
Depending on what we want to measure in the Cross Section Tool's profile, we can create the reference profile from the highest or from the lowest line segments. Depending on the choice, the Cross Section Tool goes along the points of the X-axis and seeks the corresponding lowest or highest points of the reference profile on the Y-axis. The following illustrations show two cross section profiles and the difference between the measured area with the highest and with the lowest line segments. The reference profile is marked with orange.
Finally, we might be interested in the area that is under the input profile and above the reference profile, or that is above the input profile and under the reference profile or both. Since this choice is heavily application-specific, the option is given to the users to pick the one that fits their application needs the most.
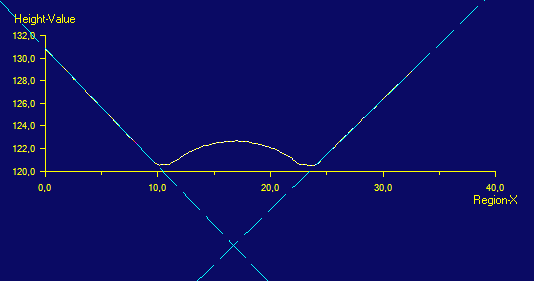
The meaning of "measuring both" the area above and the area below the reference profile always depends on the actual application. It can mean that the total area is the sum of the above and the below area, or the value of area above the reference profile minus the value of the area below the reference profile. See an example below:
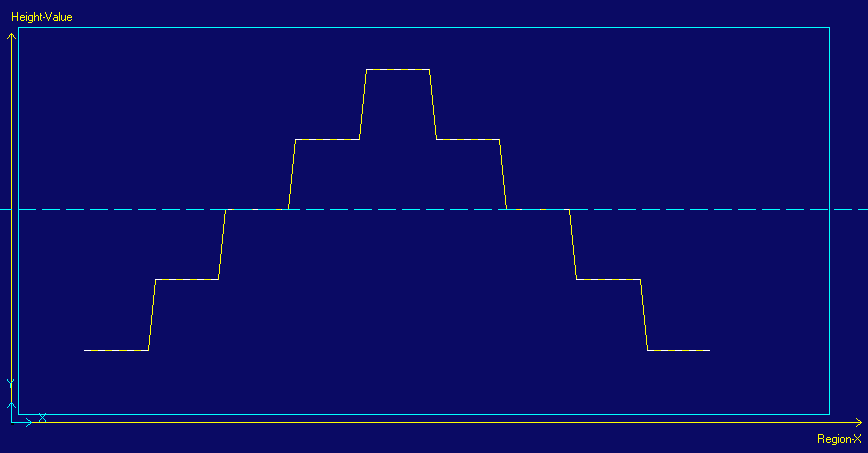
The input profile is represented by the yellow line and the line segment is the dashed light blue line. The measured area is the following:
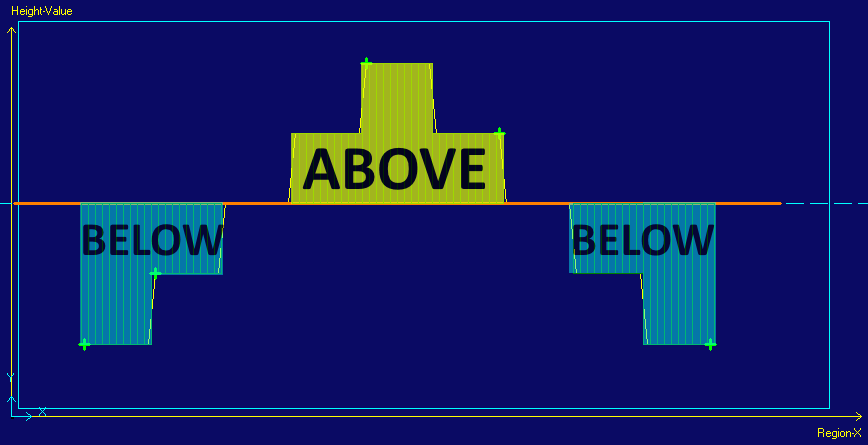
- The area painted in yellow (in the picture above) is the area above the reference profile since it is above the line segment and below the profile’s curve.
- The area painted in light blue (in the picture above) is the area below the reference profile because it is below the line segment and above the input profile’s curve.
Since we distinguish between area above the reference profile and area below the reference profile the question arise how we want to treat these separate areas when both parts are being measured. Again, it is application specific, whether their values add up or they balance out each other when summarized. Therefore the user can set what part of the area he is interested in and how it should be calculated in the case when both the area above and below the reference profile is measured. Therefore we provide the following four choices:
- Measure only the area that is above the reference profile.
- Measure only the area that is below the reference profile.
- Measure both the area that is above the reference profile and below the reference profile and add their values together, i.e. TotalArea = AreaAbove + AreaBelow
- Measure both the area that is above the reference profile and below the reference profile and subtract the value of the area below from the value of the area above., i.e. TotalArea = AreaAbove - AreaBelow
The farthest point is a point on the input profile where the difference between the input profile and the reference profile is the greatest. Likewise, the closest point is the point on the input profile where the difference between the input profile and the reference profile is the smallest. This difference is always measured along the height-value axis and the Cross Section Tool will return these closest and farthest points for both above the reference profile and below the reference profile.