This topic contains the following sections.
The Color Segmenter tool analyzes a color image in order to produce a grey scale image consisting of light pixels against a dark background, where the light pixels correspond to features from the color input that fell into one or more desirable color ranges. The grey scale image a Color Segmenter tool produces represents only those features of the color image you are interested in, and can be further analyzed with another vision tool, such as a Blob tool.
For example, the following figure shows a pattern of colored spheres and shows how a Color Segmenter tool can be used to isolate the blue ones:
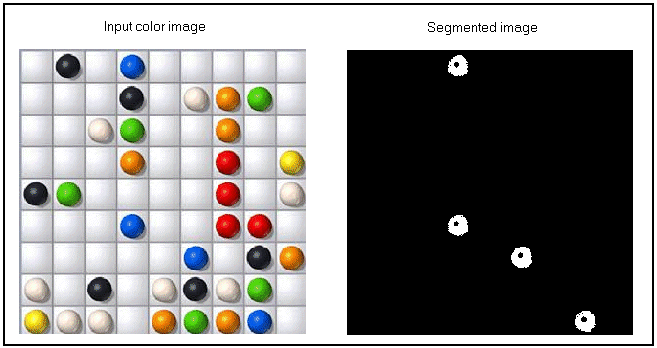
This output image can be further analyzed with a Blob tool to generate such information as the number of blue spheres, their location, their size, and so on.
For an example application using a Color Segmenter tool, see the topic Using a Color Segmenter Tool.
A Color Segmenter tool can accept images in both the Red, Green, Blue (RGB) or the Hue, Saturation, Intensity (HSI) color space, each of which uses three planar values to define any one color. See the topic Color Images for more description on color spaces. For example, the following image shows the separate planar values that define a specific color in each color space:

Since the goal of a Color Segmenter tool is to define one or more ranges of desirable color, you may find it easier to work with images defined in the HSI color space, since this allows you to narrowly define the specific hue you want to target. Once the proper Hue has been identified, adjusting the allowable range for Saturation and Intensity can often allow the Color Segmenter tool to reliably locate the features you want to analyze in the output grey scale image.
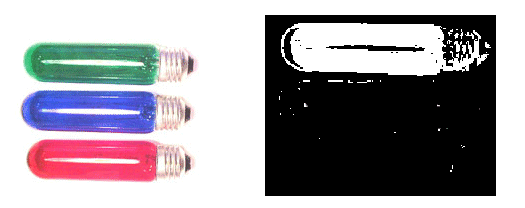
A Color Segmenter tool allows you to take a color image and separate those features that exhibit a desirable range of color. In order to perform this segmentation, you must define one or more ranges of color from a reference image, or several reference images if necessary, of the objects you want to analyze with your vision application. As the tool operates it selects any pixel within an enabled range for the segmented output image. For example, the following figure shows an input image and the segmented image it generates with a single color range for locating the green light:
The same Color Segmenter tool can be configured with a second color range for locating both the green and red lights, as shown in the following figure:
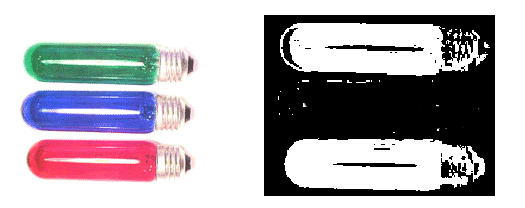
Each time the tool operates it performs a logical OR operation with all the colors ranges has it been configured to use.
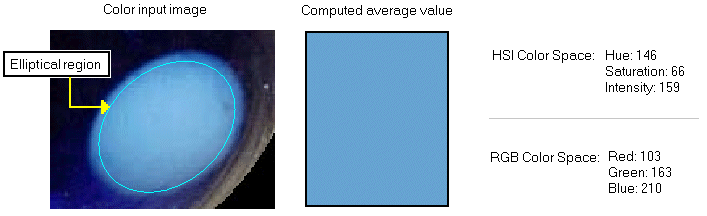
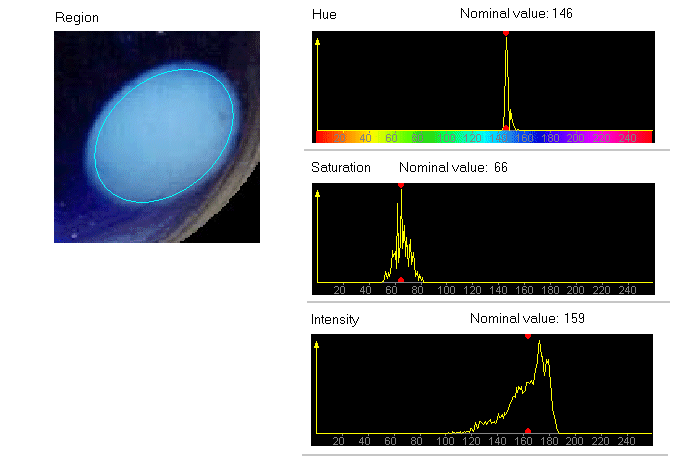
Regardless of the color space you use, you begin defining a color range by selecting a specific color from a color image. You can choose a color by referencing a single pixel or an entire region of pixels. This allows the Color Segmenter tool to compute the average, or nominal value, for each of the three planar values in the RGB and HSI color space. For example, the following figure shows the region of a color image used to generate a starting point for a color range:
Whether you define a color using a single pixel or a region of pixels from the color image, the Color Segmenter tool can display a histogram marking the nominal value in each color plane in the color space you choose to use. For example, the following figure shows the histograms in the Hue, Saturation and Intensity planes for the pixels taken from the region in the previous figure:
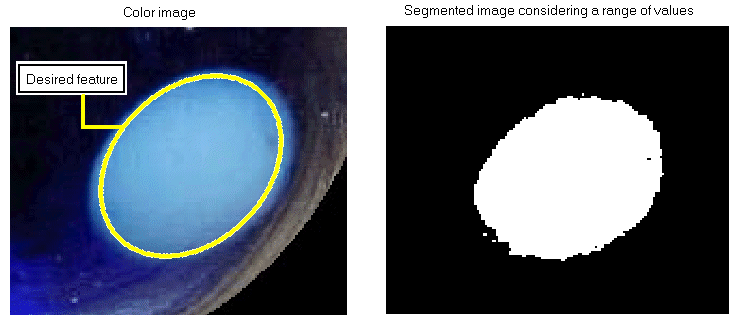
At this point, the tool has a target color for the color range you want to use, but lacks any information on how closely the tool must adhere to the nominal values when considering all the pixels in an acquired image. If the tool uses just the nominal values for identifying pixels that match the desired color, it will consistently fail to identify many pixels that should be represented in the segmented output image. For example, the following figure shows a section of a color image along with the segmented image it generates when the tool considers only those pixels with identical nominal values to be a match:

If you allow the tool to consider pixels within a range of the nominal value in each plane to be a match, then it can generate more desirable results, as shown in the following figure:
Any color range you define will consist of the nominal values in each color plane along with the tolerance settings that define a boundary of values that you want the tool to consider.
The tolerance values you establish for any color range determine how closely the features in a color image must match a narrowly defined color in order to be represented in the segmented output image. For each color plane in the RGB or HSI color space, the nominal value is bordered by a low tolerance setting and a high tolerance setting, which together determine the complete range of pixel values that the tool will consider to be a match. The edit control generates initial settings for the low tolerance and high tolerance automatically, but allows you to modify these settings as necessary for the Color Segmenter tool to take the pixels that represent the features of interest and include them in the segmented output image.
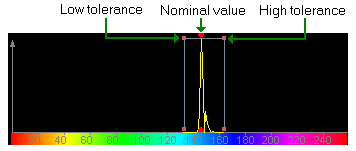
For each color plane in the color space you choose to use, a Color Segmenter tool provides the following graphics to indicate the nominal value along with the current low tolerance and high tolerance settings:
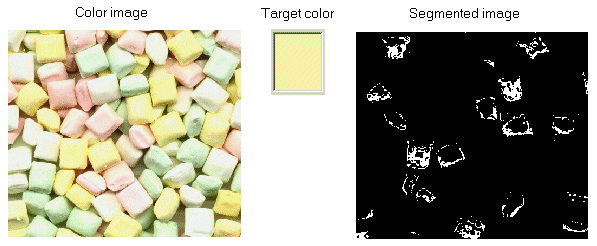
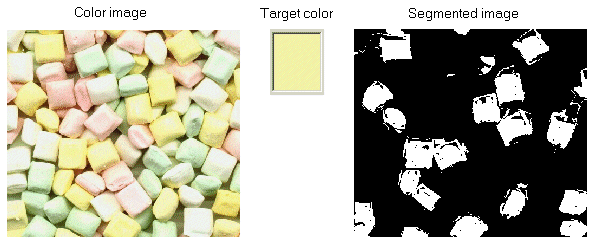
As you configure a Color Segmenter tool, you can select the graphic handles representing either the low tolerance or the high tolerance and adjust them as necessary. The effect of the change depends on the colors in the image and the specific color plane you are working with at the time. For most applications, you will have to adjust the low tolerance and high tolerance on all three color planes to generate the desired results. For example, the following figure shows a color image and the initial result of a Color Segmenter tool configured to locate yellow mints:
Since the Hue plane is already configured to locate the desired colored mints, adjusting the low tolerance and high tolerance settings for Saturation and Intensity can provide a better result:
Finding the best settings for the low and high tolerance values is an iterative process:
- Change the current values for low tolerance and high tolerance along any particular color plane.
- Run the tool again to generate a new segmented output image
- Examine the effects on the output image
- Adjust the values for low tolerance and high tolerance settings further.
By default, a Color Segmenter tool generates a grey scale output image where pixels having a value of 255 represent features from the original color image you are interested in examining further while pixels with a grey value of 0 represent all other features.
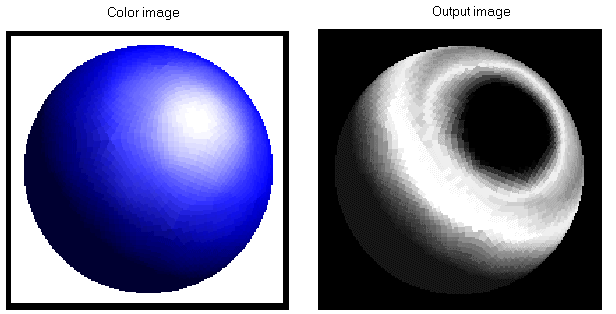
In some applications, it is not only necessary to distinguish the color of a feature of interest, but also to represent the degree of the color in the output image. For example, the following figure shows a color image and the output image it can generate when configured to find a limited color range of blue pixels:

If an application needed more information on the value of various shades of blue in the color image, the settings of the Color Segmenter tool can be further modified so that it generates an output image with various degrees of grey values, where blue features that are close to the defined range generate lighter grey values and features that are more removed from the defined range generate darker grey values. For example, the following figure shows the same color image and the output image it can generate when the tool is configured to assign different grey values to various degrees of blue:
To generate an output image with various shades of grey values, you define a softness range surrounding the color range for any particular color plane. The Color Segmenter forces a uniform value for the softness range. As you configure a Color Segmenter tool, it includes the following graphics for changing the softness range:

As you set a softness range, the Color Segmenter tool changes of the color of pixels within the histogram, as follows:
- Pixels within the color range appear in yellow.
- Pixels outside the color range and within the softness range appear in white.
- Pixels outside both the color range and the softness range appear in grey.
The following figure shows a histogram with a defined softness range:

In general, if you are using the Color Segmenter tool to generate an image mask then you do not want to specify a softness range. Otherwise, specifying a softness range can provide useful information regarding the appearance of the desired color, or colors, in your run-time images. For example, the following image shows successive images of objects where the grey-level at any particular location can provide useful diagnostic information:
