InspectBead
The InspectBead function Functions are tools that are available in Spreadsheet for processing and analyzing acquisitions or other results. You can add functions to your Spreadsheet job to create tool chains and produce results for specific applications. is used to identify positional, width, or coverage defects in a bead. The InspectBead tool has parameters to control the bead analysis criteria and measurement rules. The tool compares the bead characteristics found in the currently acquired image against the bead analysis criteria. For more information on the TrainBead function, see TrainBead.
- The TrainBead and InspectBead functions do not support color images. If you load a color image, the functions automatically convert it to a greyscale image.
- For more information about how to use the TrainBead and InspectBead functions, see How to use TrainBead and InspectBead Tools.
InspectBead Inputs
General Tab
Syntax: InspectBead(Image,Bead Find,Edit Inspection Areas,Bead Edge Position Tolerance (%),Contrast Threshold,Defect Limits,Show Graphics)
| Parameter | Description | ||||||||||||||||||||||
|---|---|---|---|---|---|---|---|---|---|---|---|---|---|---|---|---|---|---|---|---|---|---|---|
|
Image |
This argument must reference a spreadsheet
cell that contains a valid Image data structure. By default, the cell references |
||||||||||||||||||||||
| TrainBead |
Specifies a reference to a spreadsheet cell that contains a Bead data structure output by the TrainBead function. Note:
|
||||||||||||||||||||||
| Edit Inspection Areas |
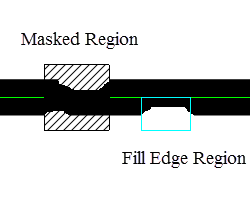
Click this button to enter Interactive Graphics Mode to edit areas that can be masked out from the inspection or allow fill edges. You can do the following:
|
||||||||||||||||||||||
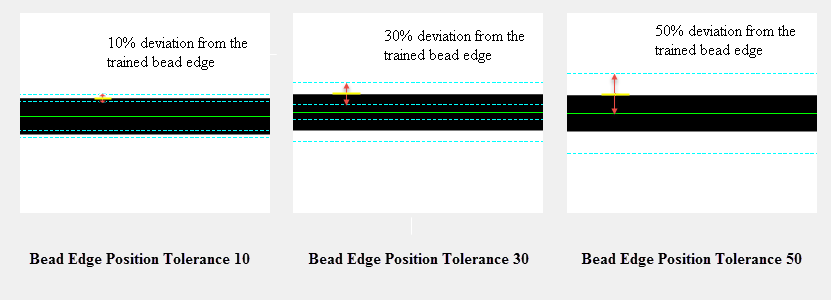
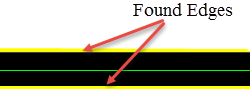
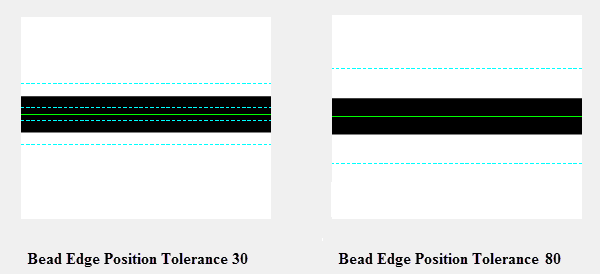
| Bead Edge Position Tolerance (%) |
Specifies the maximum amount (1 to 1000; default = 50) an edge can deviate from the trained edge position as a percentage of the average bead width at that location. Bead edges that are outside of this tolerance range are not going to be found. An edge must be found between the trained bead path (in green) and the Position Tolerance Boundary (in cyan). The Bead Edge Position Tolerance (%) value is measured from the trained edge position on either side of the expected edge. The average bead width is considered 100%. The trained bead path is in the middle of the bead, which is 50% deviated from the trained edge position. If the position tolerance is less than 50%, two dashed lines on either side of the bead path appear. If the position tolerance is 50% or greater, only one single dashed line is displayed on either side of the bead path.
|
||||||||||||||||||||||
| Contrast Threshold |
Specifies the minimum valid edge contrast value (1 to 255; default = 10). Bead edges with contrast values below this threshold are identified as defects. |
||||||||||||||||||||||
| Defect Limits |
Specifies how defects are defined and whether a particular type of defect needs to be detected.
|
||||||||||||||||||||||
| Show Graphics |
Specifies which InspectBead graphical overlays are drawn on top of the image.
|
Defects Tab
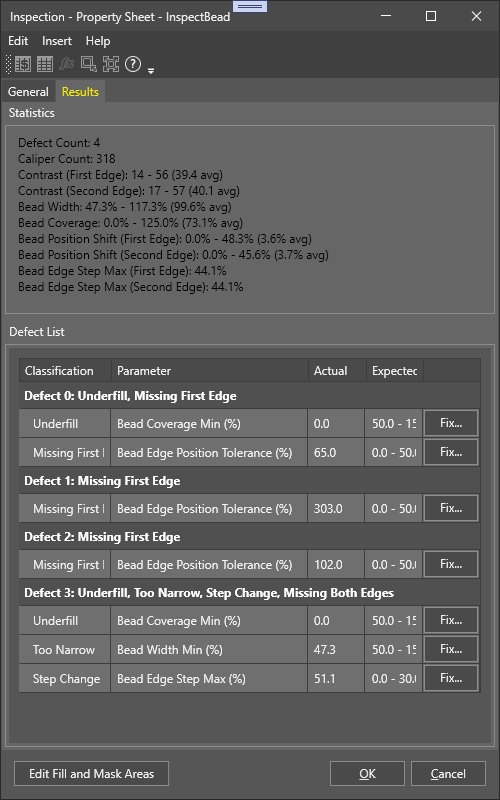
The Defects tab displays the overall results for bead inspection, and is divided into two sections: statistics and defect list.
Statistics
The statistics contain the following data and updates automatically after each image is loaded or after a change is made to the InspectBead function.
- Defect Count: Displays the total number of defects found in the bead.
- Caliper Count: Displays the total number of calipers in the bead path.
- Contrast (First Edge): Displays the minimum, maximum, and average contrast value along the first edge of the bead.
- Contrast (Second Edge): Displays the minimum, maximum, and average contrast value along the second edge of the bead.
- Bead Width: Displays the minimum, maximum, and average width as a percentage of the bead.
- Bead Coverage: Displays the bead coverage as a percentage of the bead.
- Bead Position Shift (First Edge): Displays the minimum, maximum, and average deviation of the first edge as a percentage of the bead width.
- Bead Position Shift (Second Edge): Displays the minimum, maximum and average deviation of the second edge as a percentage of the bead width.
- Bead Edge Step Max (First Edge): Displays the maximum step change as a percentage of the bead width along the first edge of the bead.
- Bead Edge Step Max (Second Edge): Displays the maximum step change as a percentage of the bead width along the second edge of the bead.
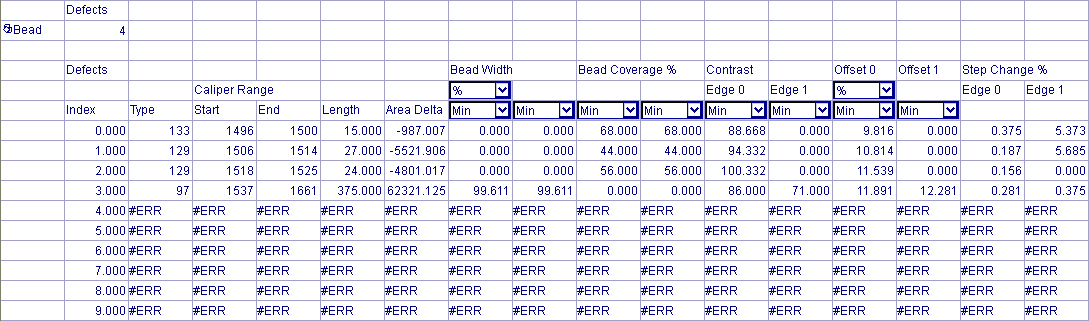
Defect Results Table
For each defect, the defect table displays the following:
| Parameter | Description | |||||||||||||||||||||||||||||
|---|---|---|---|---|---|---|---|---|---|---|---|---|---|---|---|---|---|---|---|---|---|---|---|---|---|---|---|---|---|---|
| Index | Displays the defect index number. | |||||||||||||||||||||||||||||
| Classification |
Displays defect type. Defect Types:
|
|||||||||||||||||||||||||||||
| Parameter | Displays the InspectBead parameter that is associated with the defect. | |||||||||||||||||||||||||||||
| Actual | Displays the actual value reported by the InspectBead function. | |||||||||||||||||||||||||||||
| Expected | Displays the allowed value range specified by the InspectBead parameters. | |||||||||||||||||||||||||||||
| Fix (button) |
Provides the following tuning options to remove false defects from the defect results table:
|
Editing the Inspection Areas
Click Edit Fill and Mask Areas to edit the inspection areas.
You have the following options:
-
Area Select Adds Mask: Mask the selected area.
-
Area Select Adds Fill: Fill the selected area.
-
Area Select Clears Mask/Fill: Clear the masking or filling of the selected area.
InspectBead Outputs
|
Returns |
A Bead data structure containing the information about detected beads in the image, or #ERR if any of the input parameters are invalid. |
|
Results |
When InspectBead is initially inserted into a cell, a results table is created in the spreadsheet. For example, this is the default InspectBead results table:
Note:
|