ViDiELClassify
With the ViDiELClassify tool, you can identify and classify an object or entire scene on an image, and predict an identified or classified picture segment on a batch of images. The ViDiELClassify tool utilizes deep learning technology to distinguish characteristics and differences of a selected image part, giving you real-time feedback on your training progress.
Workflow
-
Drag and drop the ViDiELClassify tool to your Spreadsheet.
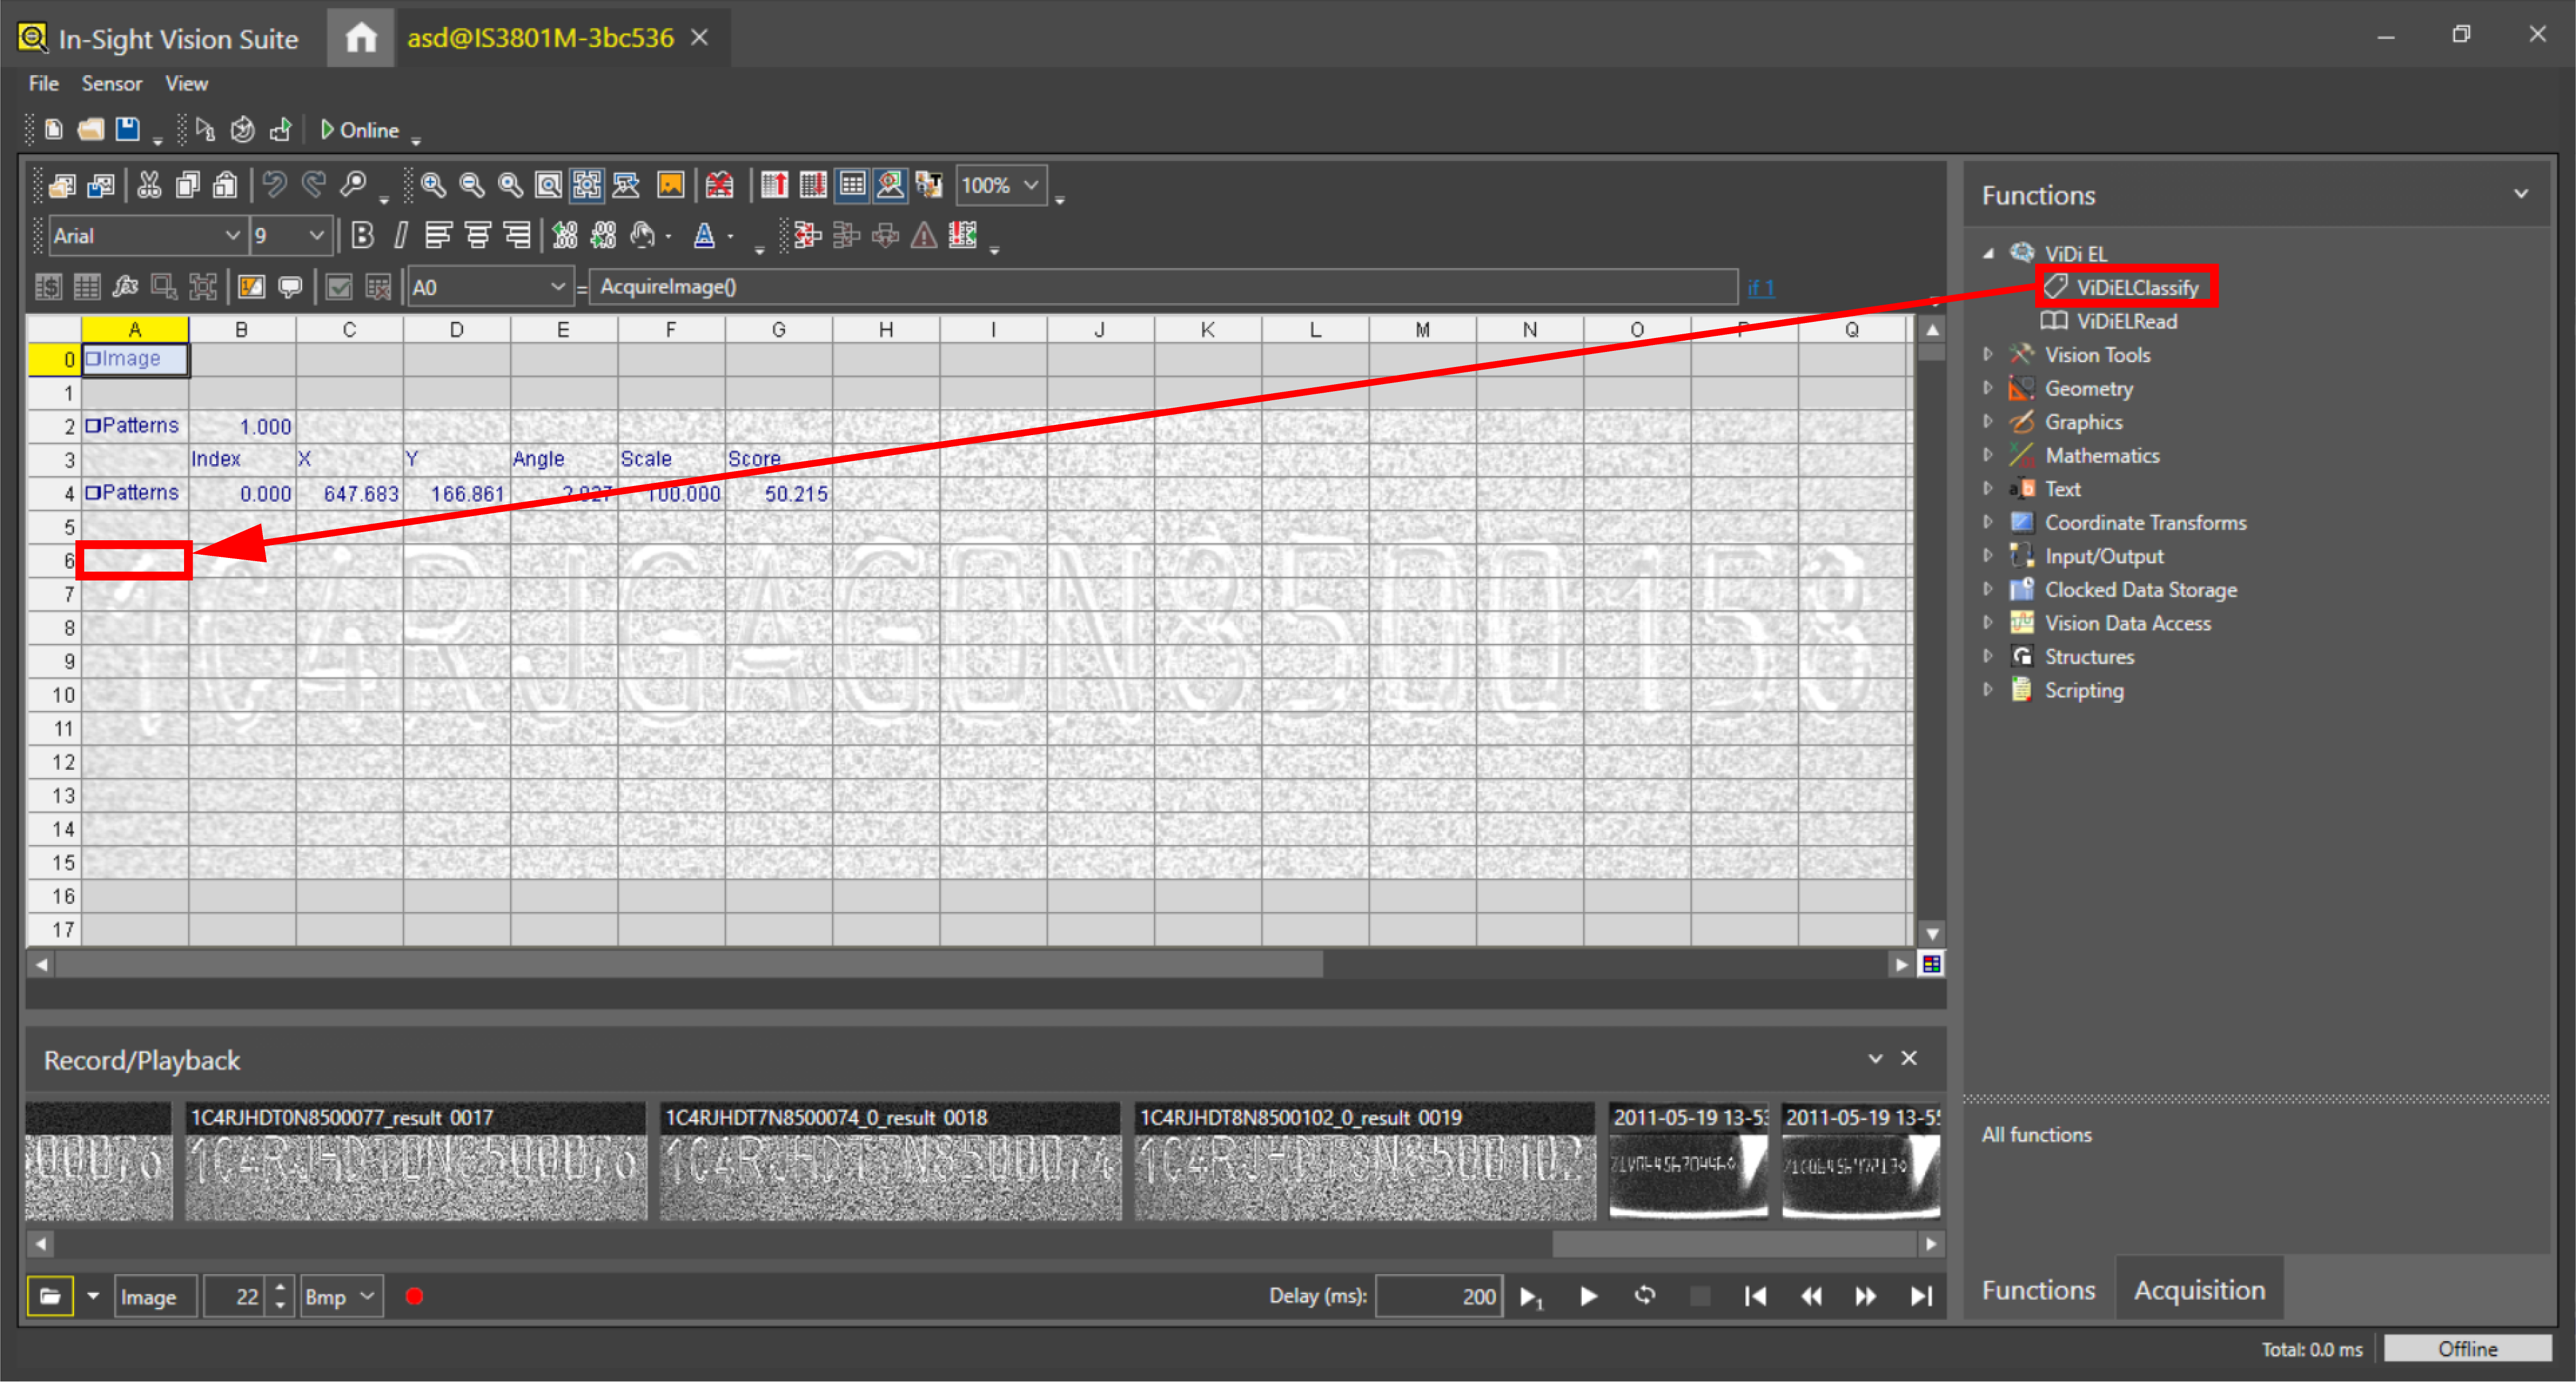 Note: In this example, we have already acquired a filmstrip and created a fixture. To create a filmstrip, see Managing Filmstrip. To create a fixture, see Train the TrainPatMaxRedLine Function and FindPatMaxRedLine.
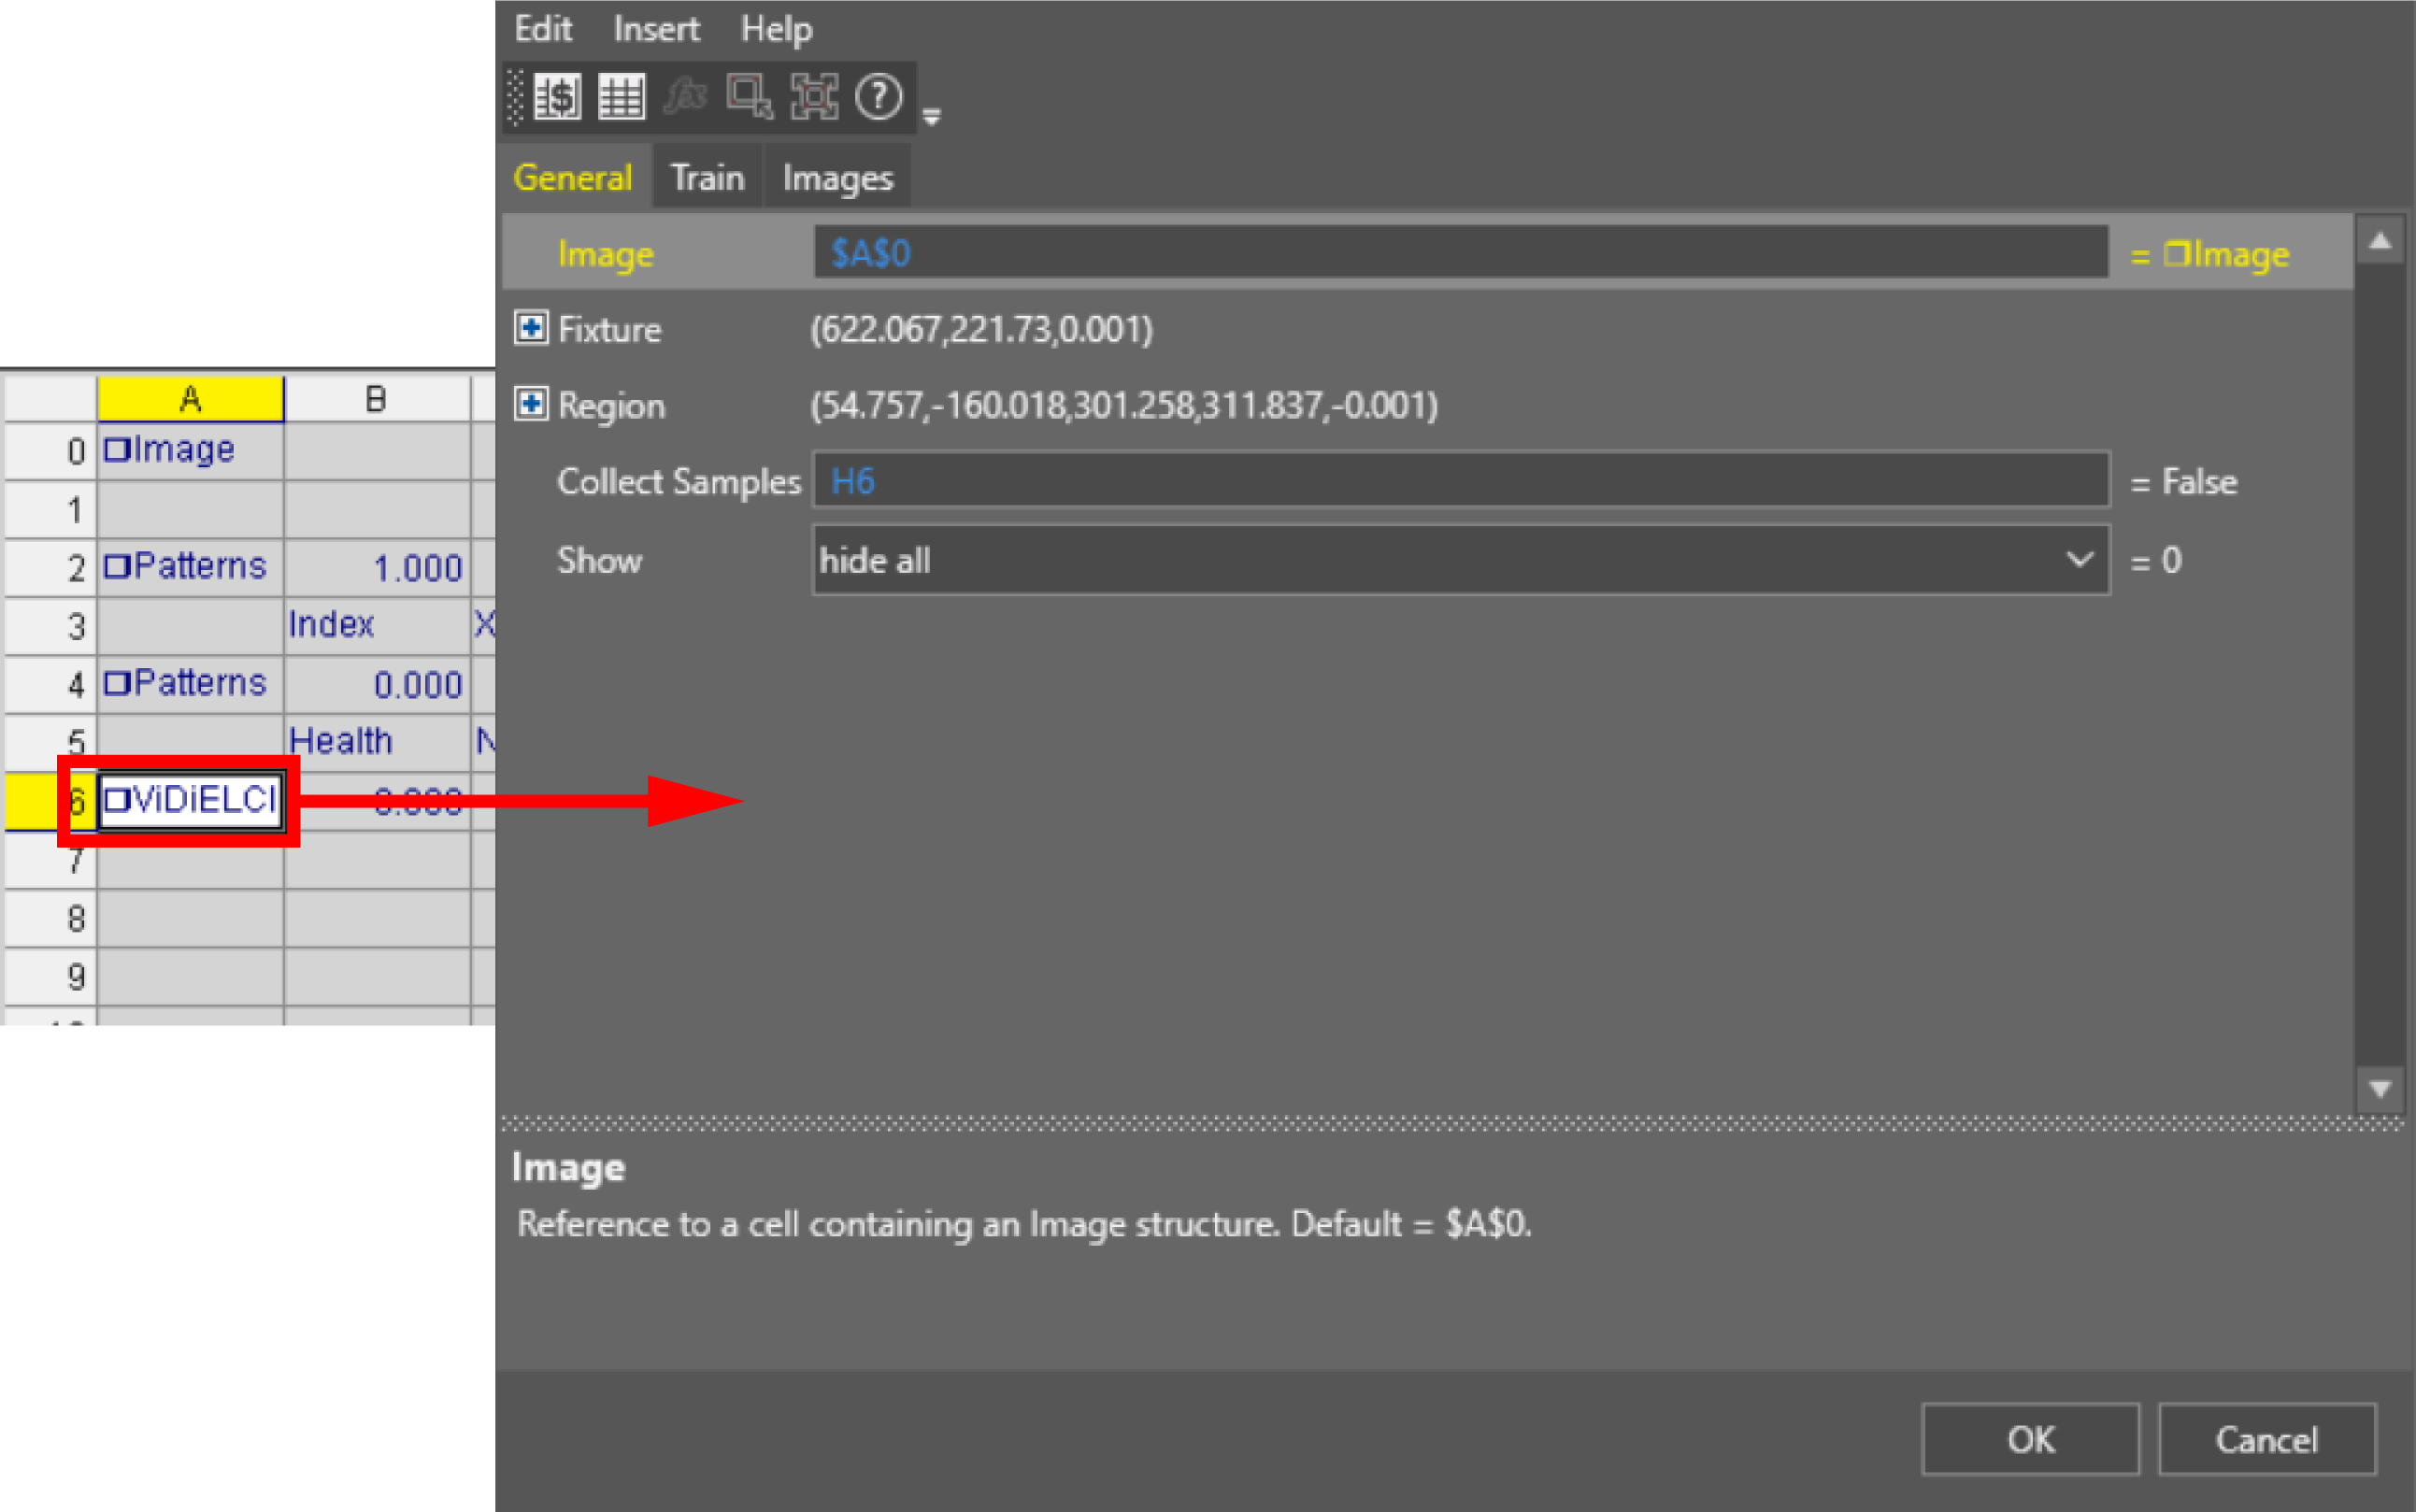
The Property Sheet pops up.
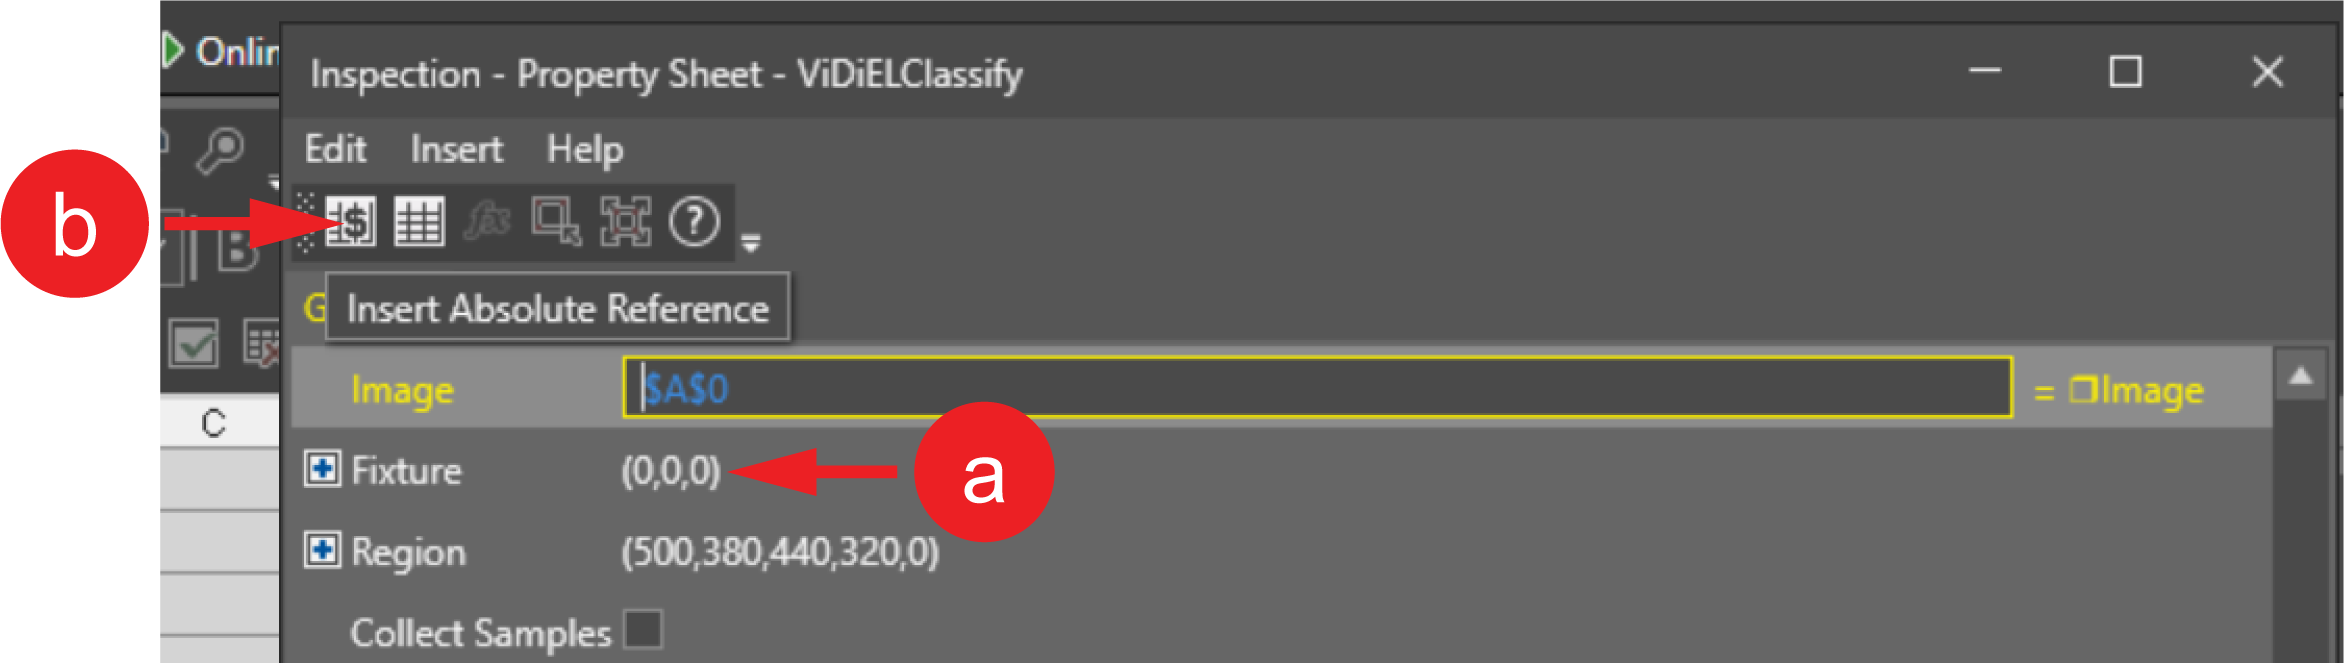
- Specify the fixture region:
- Click on Fixture to open the coordinate cells.
Click Insert Absolute Reference on the upper left corner of the pane.
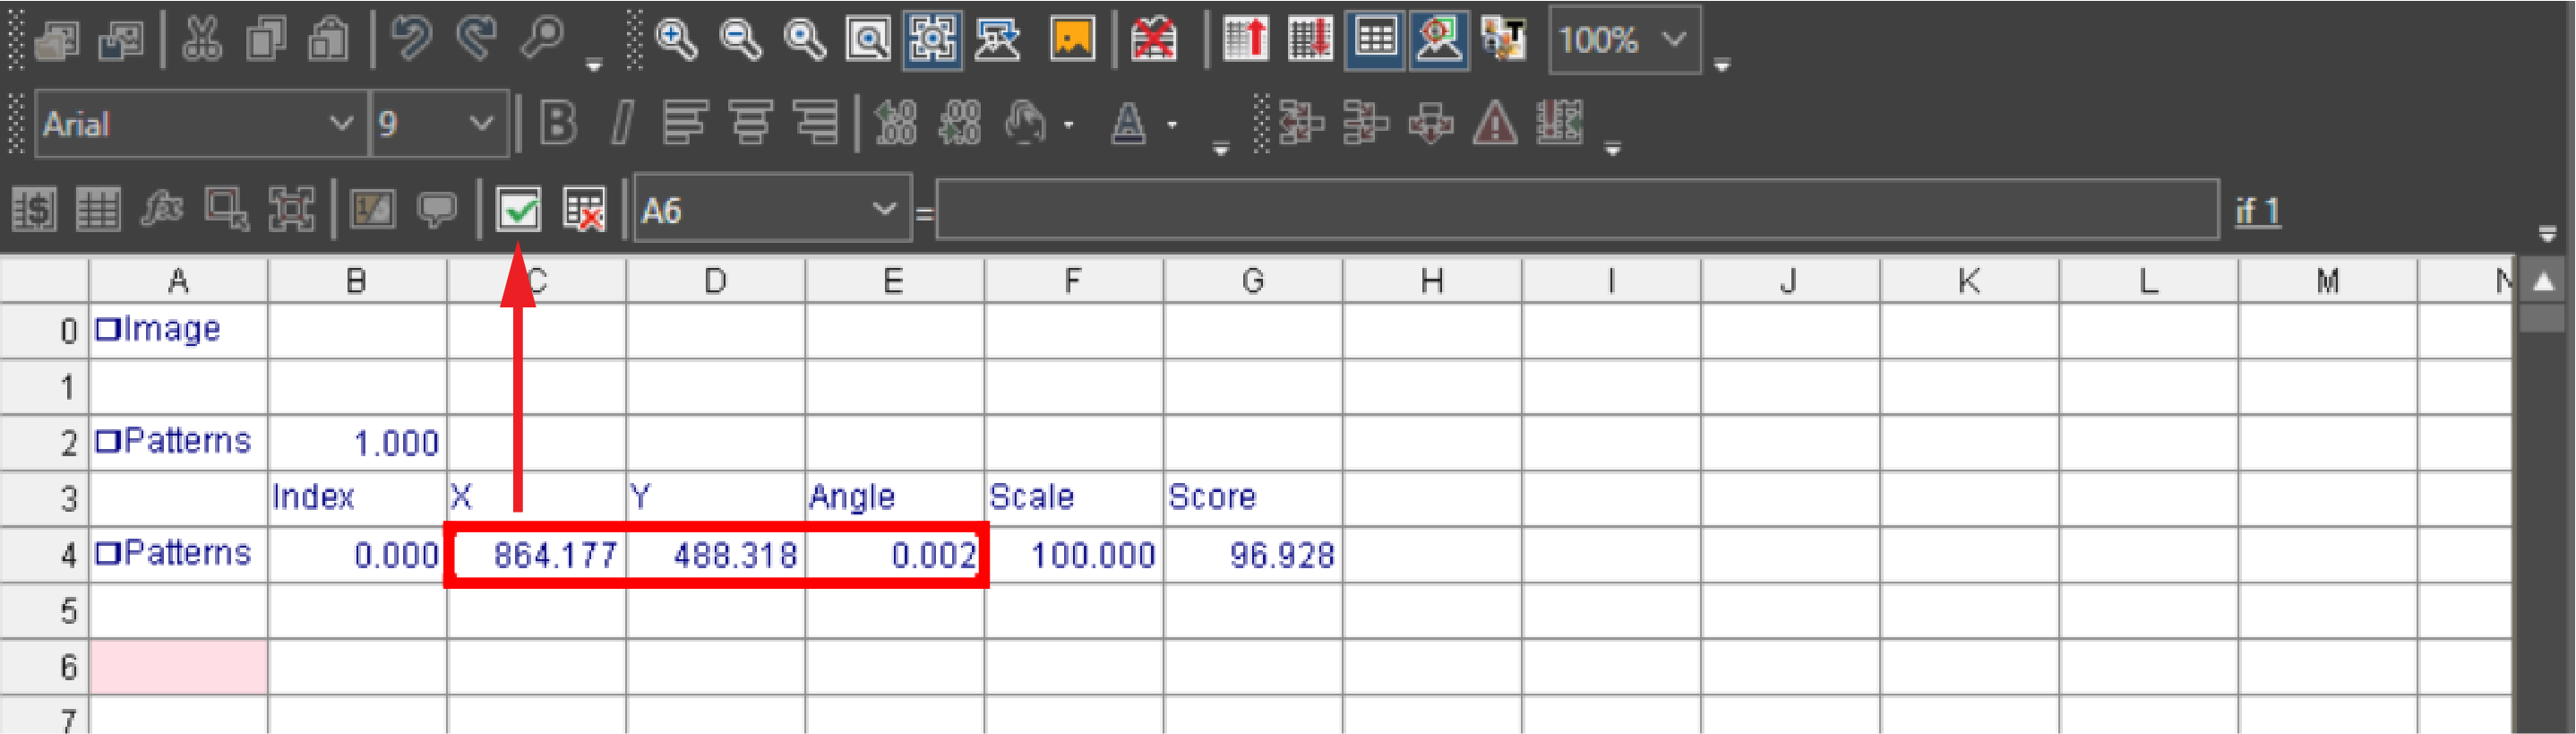
Select the fixture coordinates from the Spreadsheet and click Accept changes.
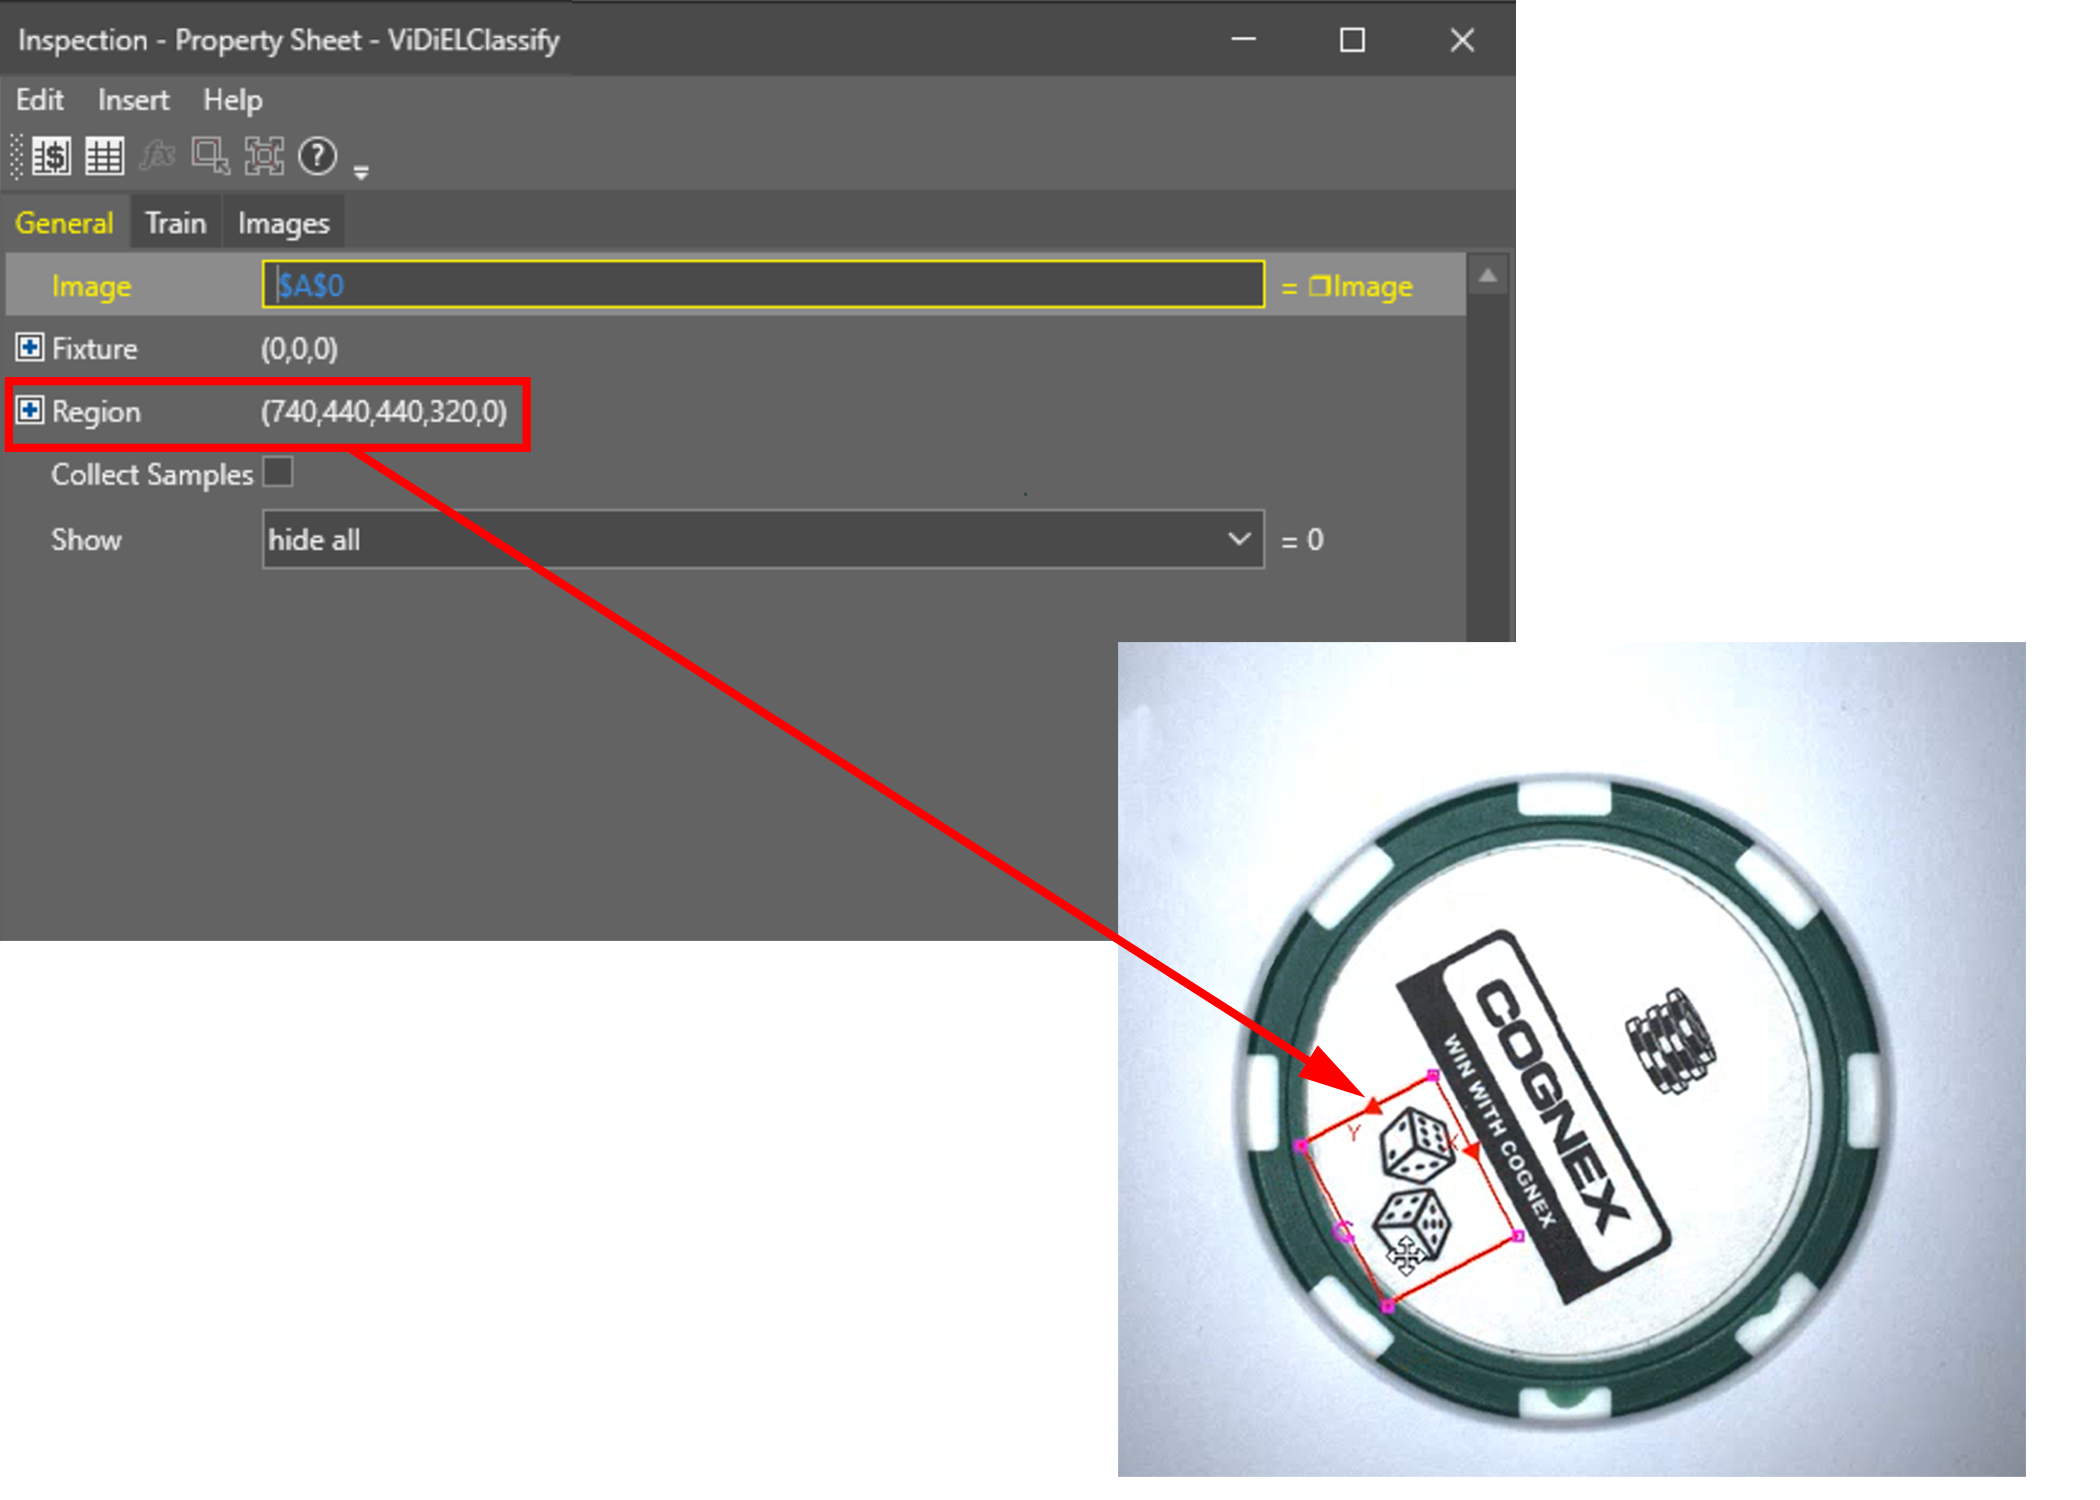
Select the Region in your image for which you want to train the ViDiELClassify tool.
- To train the ViDiELClassify tool:
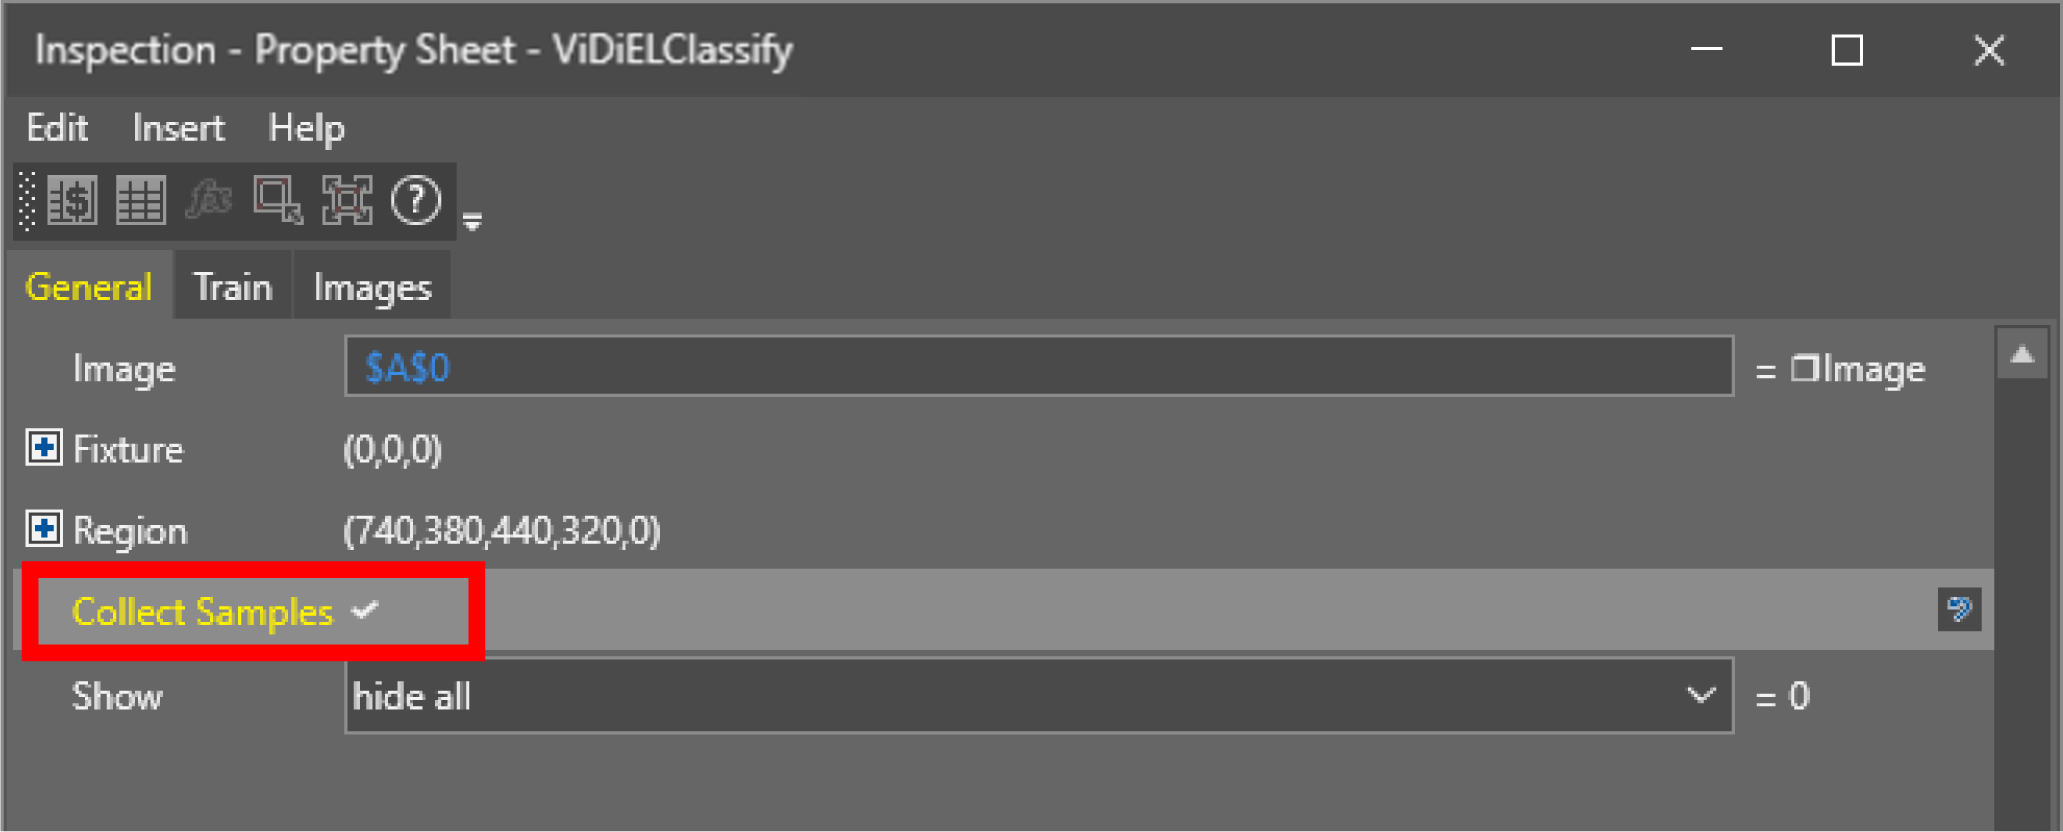
Check Collect samples on the General tab of the Property sheet to collect your images from the filmstrip.
 Note:
Note:- The maximum number of collectable samples is 300.
- You cannot change the size of region of interest or the image type after you have started collecting samples.
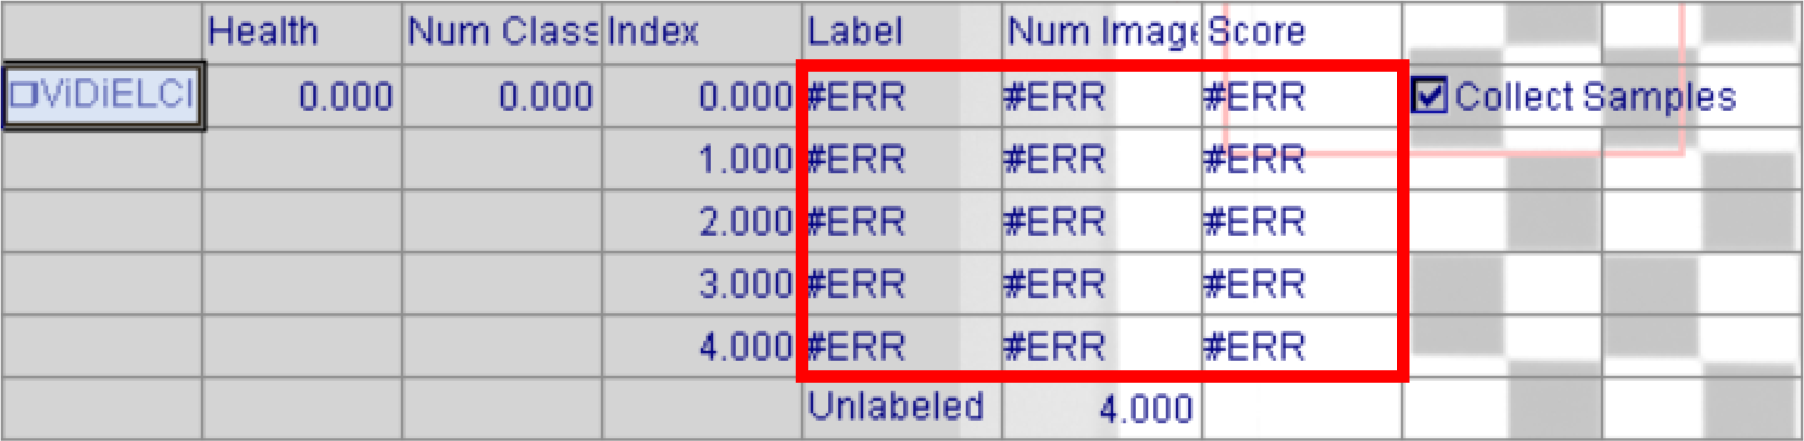
Collecting samples automatically populates the Spreadsheet with label values. As you have not trained any images yet, they all stand in #ERR state.
To include images in the training, go to
Note: Make sure you add images with every class type that you want to use in training the ViDiELClassify tool.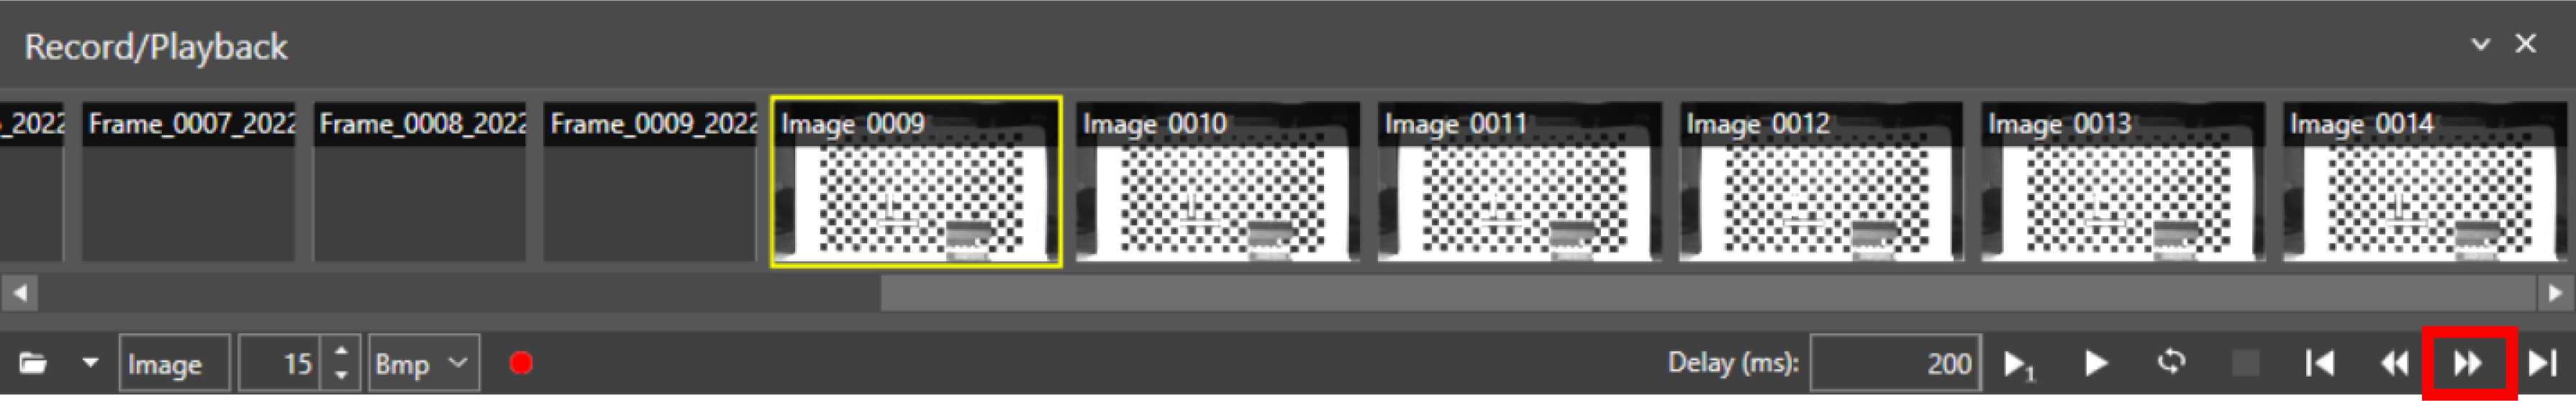
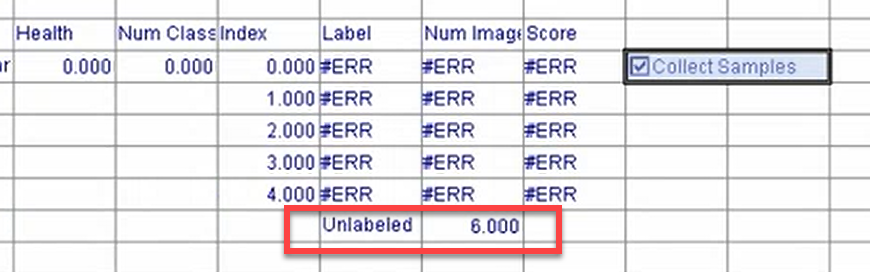
The Spreadsheet function shows you how many unlabeled images are in the tool - meaning, how many images you added from the Filmstrip.
To learn more about the ViDiELClassify outputs, see the table below.
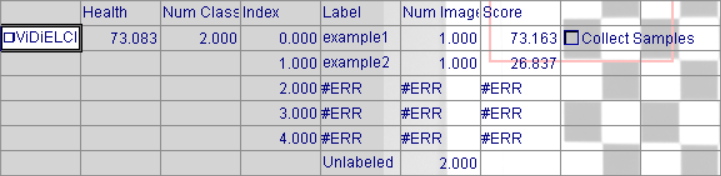
Parameter Description Health Shows the health value of the model. Num Class Shows the number of classes you specified. Label Lists the specified class names. Num Image Shows the number of images attributed to the respective class. Score Shows the best prediction for the images attributed to the respective class.
Note: Confidence Score is a score between 0-100 (100 being the most confident). The score denotes the confidence that the prediction of the ViDiELClassify tool is correct and ViDiELClassify tool labels a particular image accurately.Unlabeled Shows the number of images which you have not labeled manually. - Now you can start training the tool.
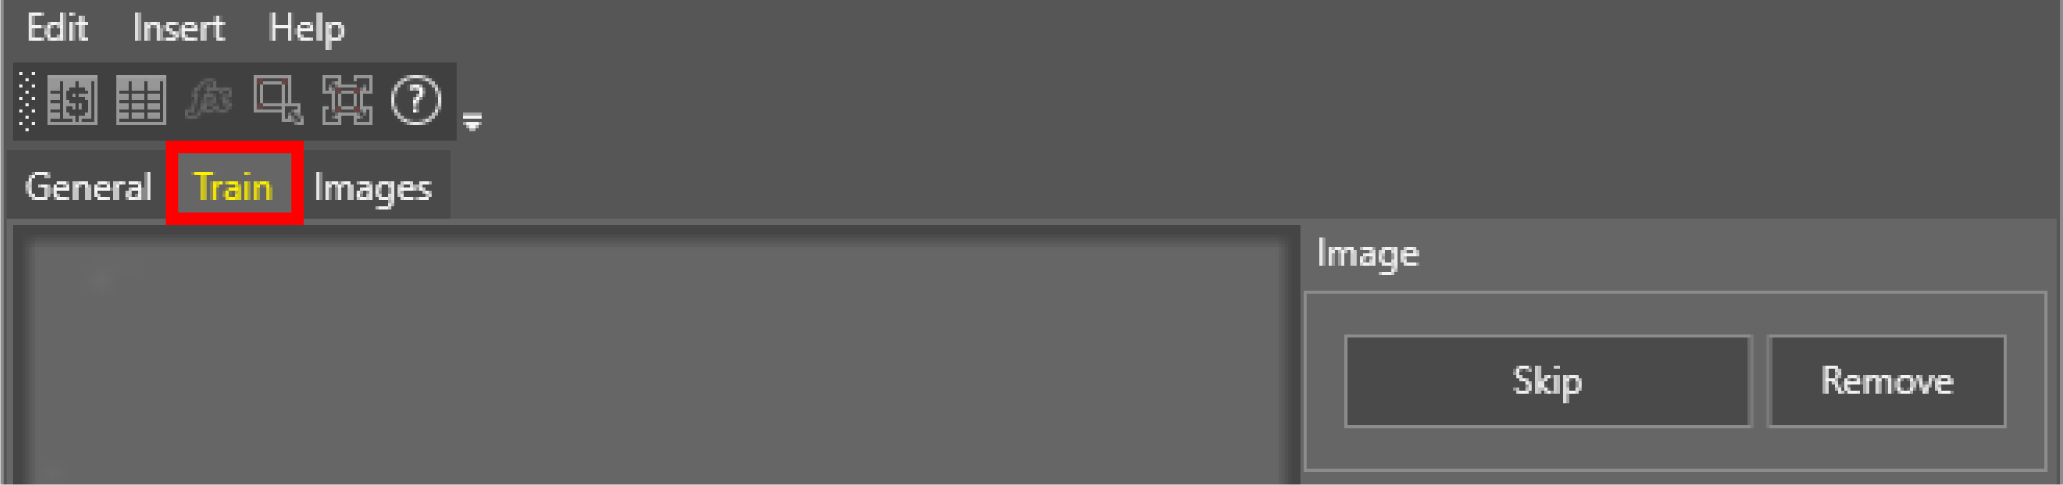
Double click on the
Click on the Train tab.
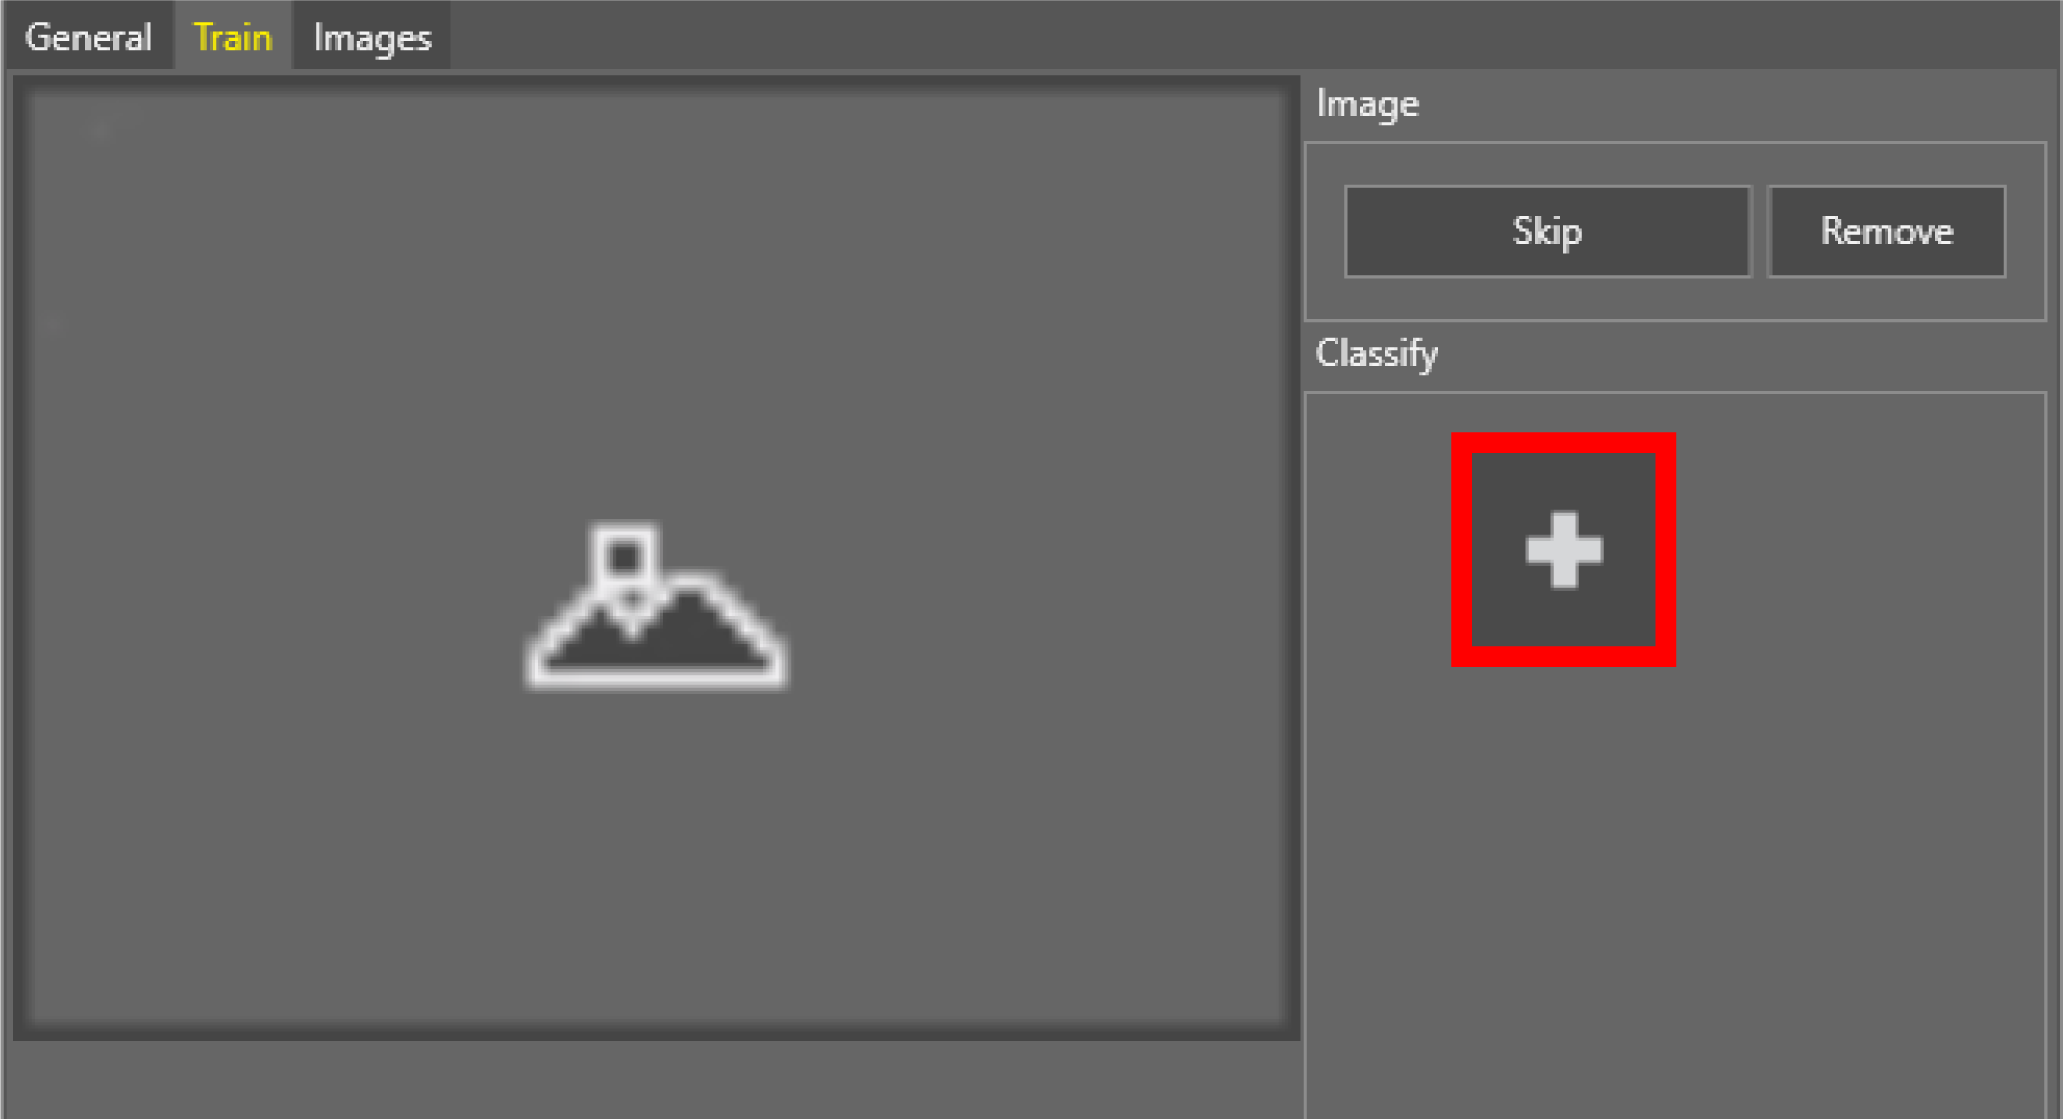
Click on Add New Class to add new classes.
Click the corresponding class to classify the image.
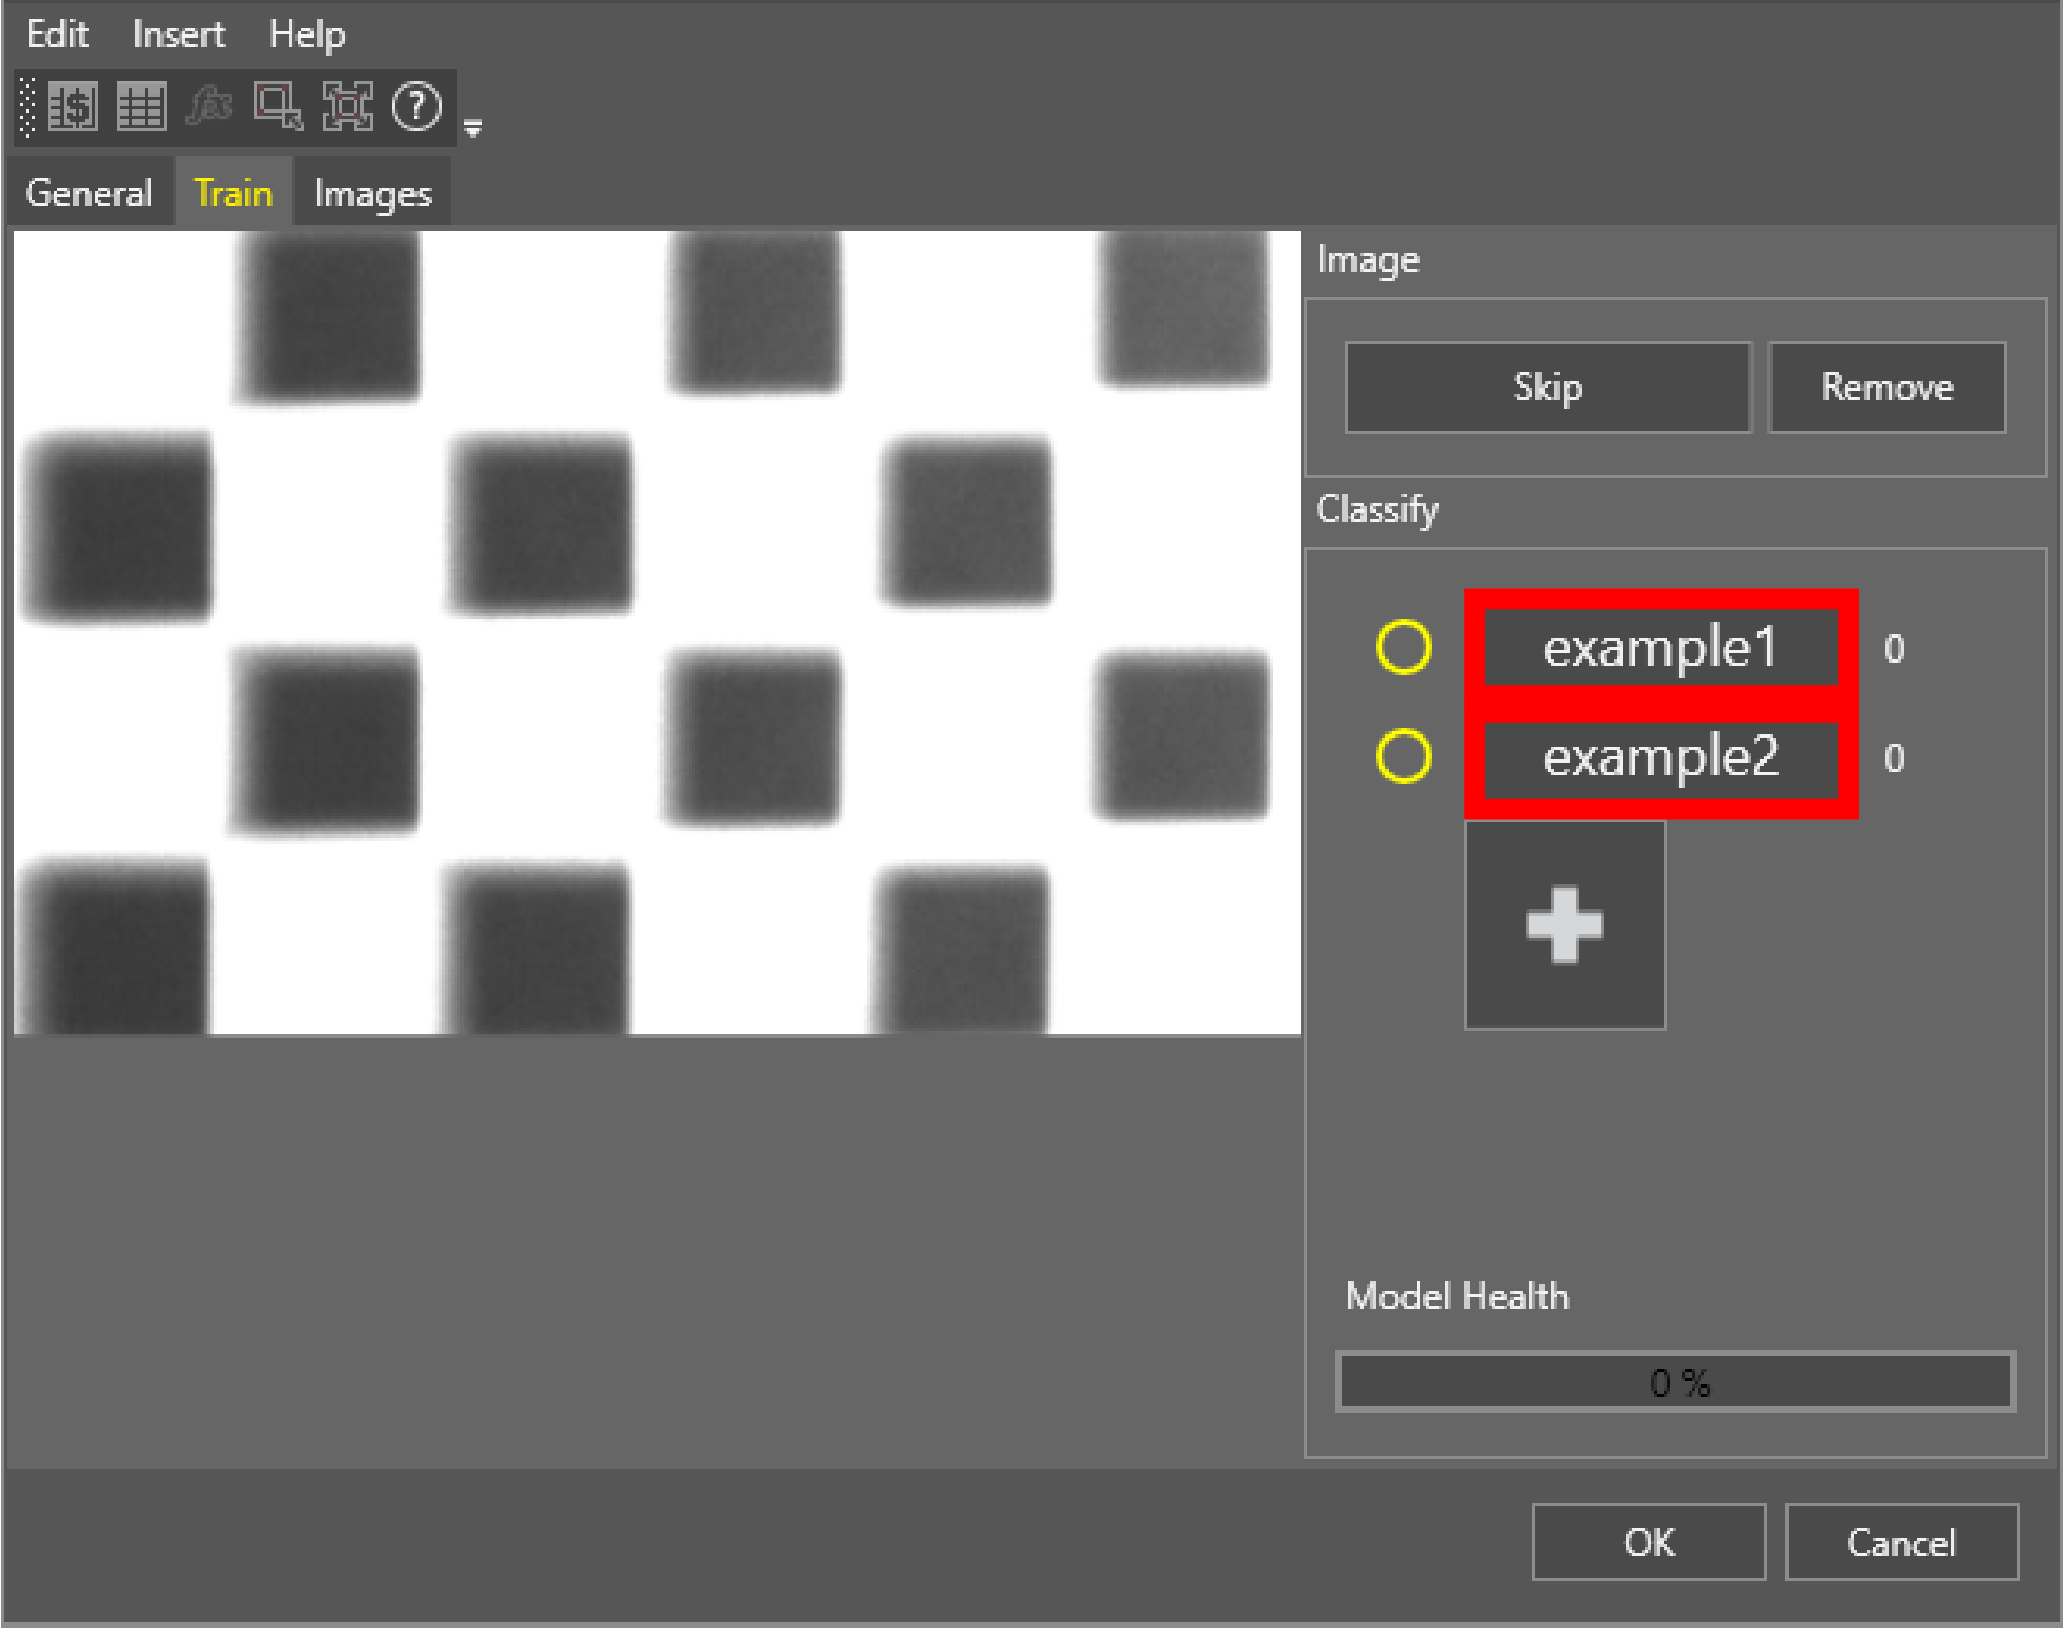 Note: The numbers next to the classes note the number of images which you have labeled with that particular class.
To learn more about the Train tab, see the table below.
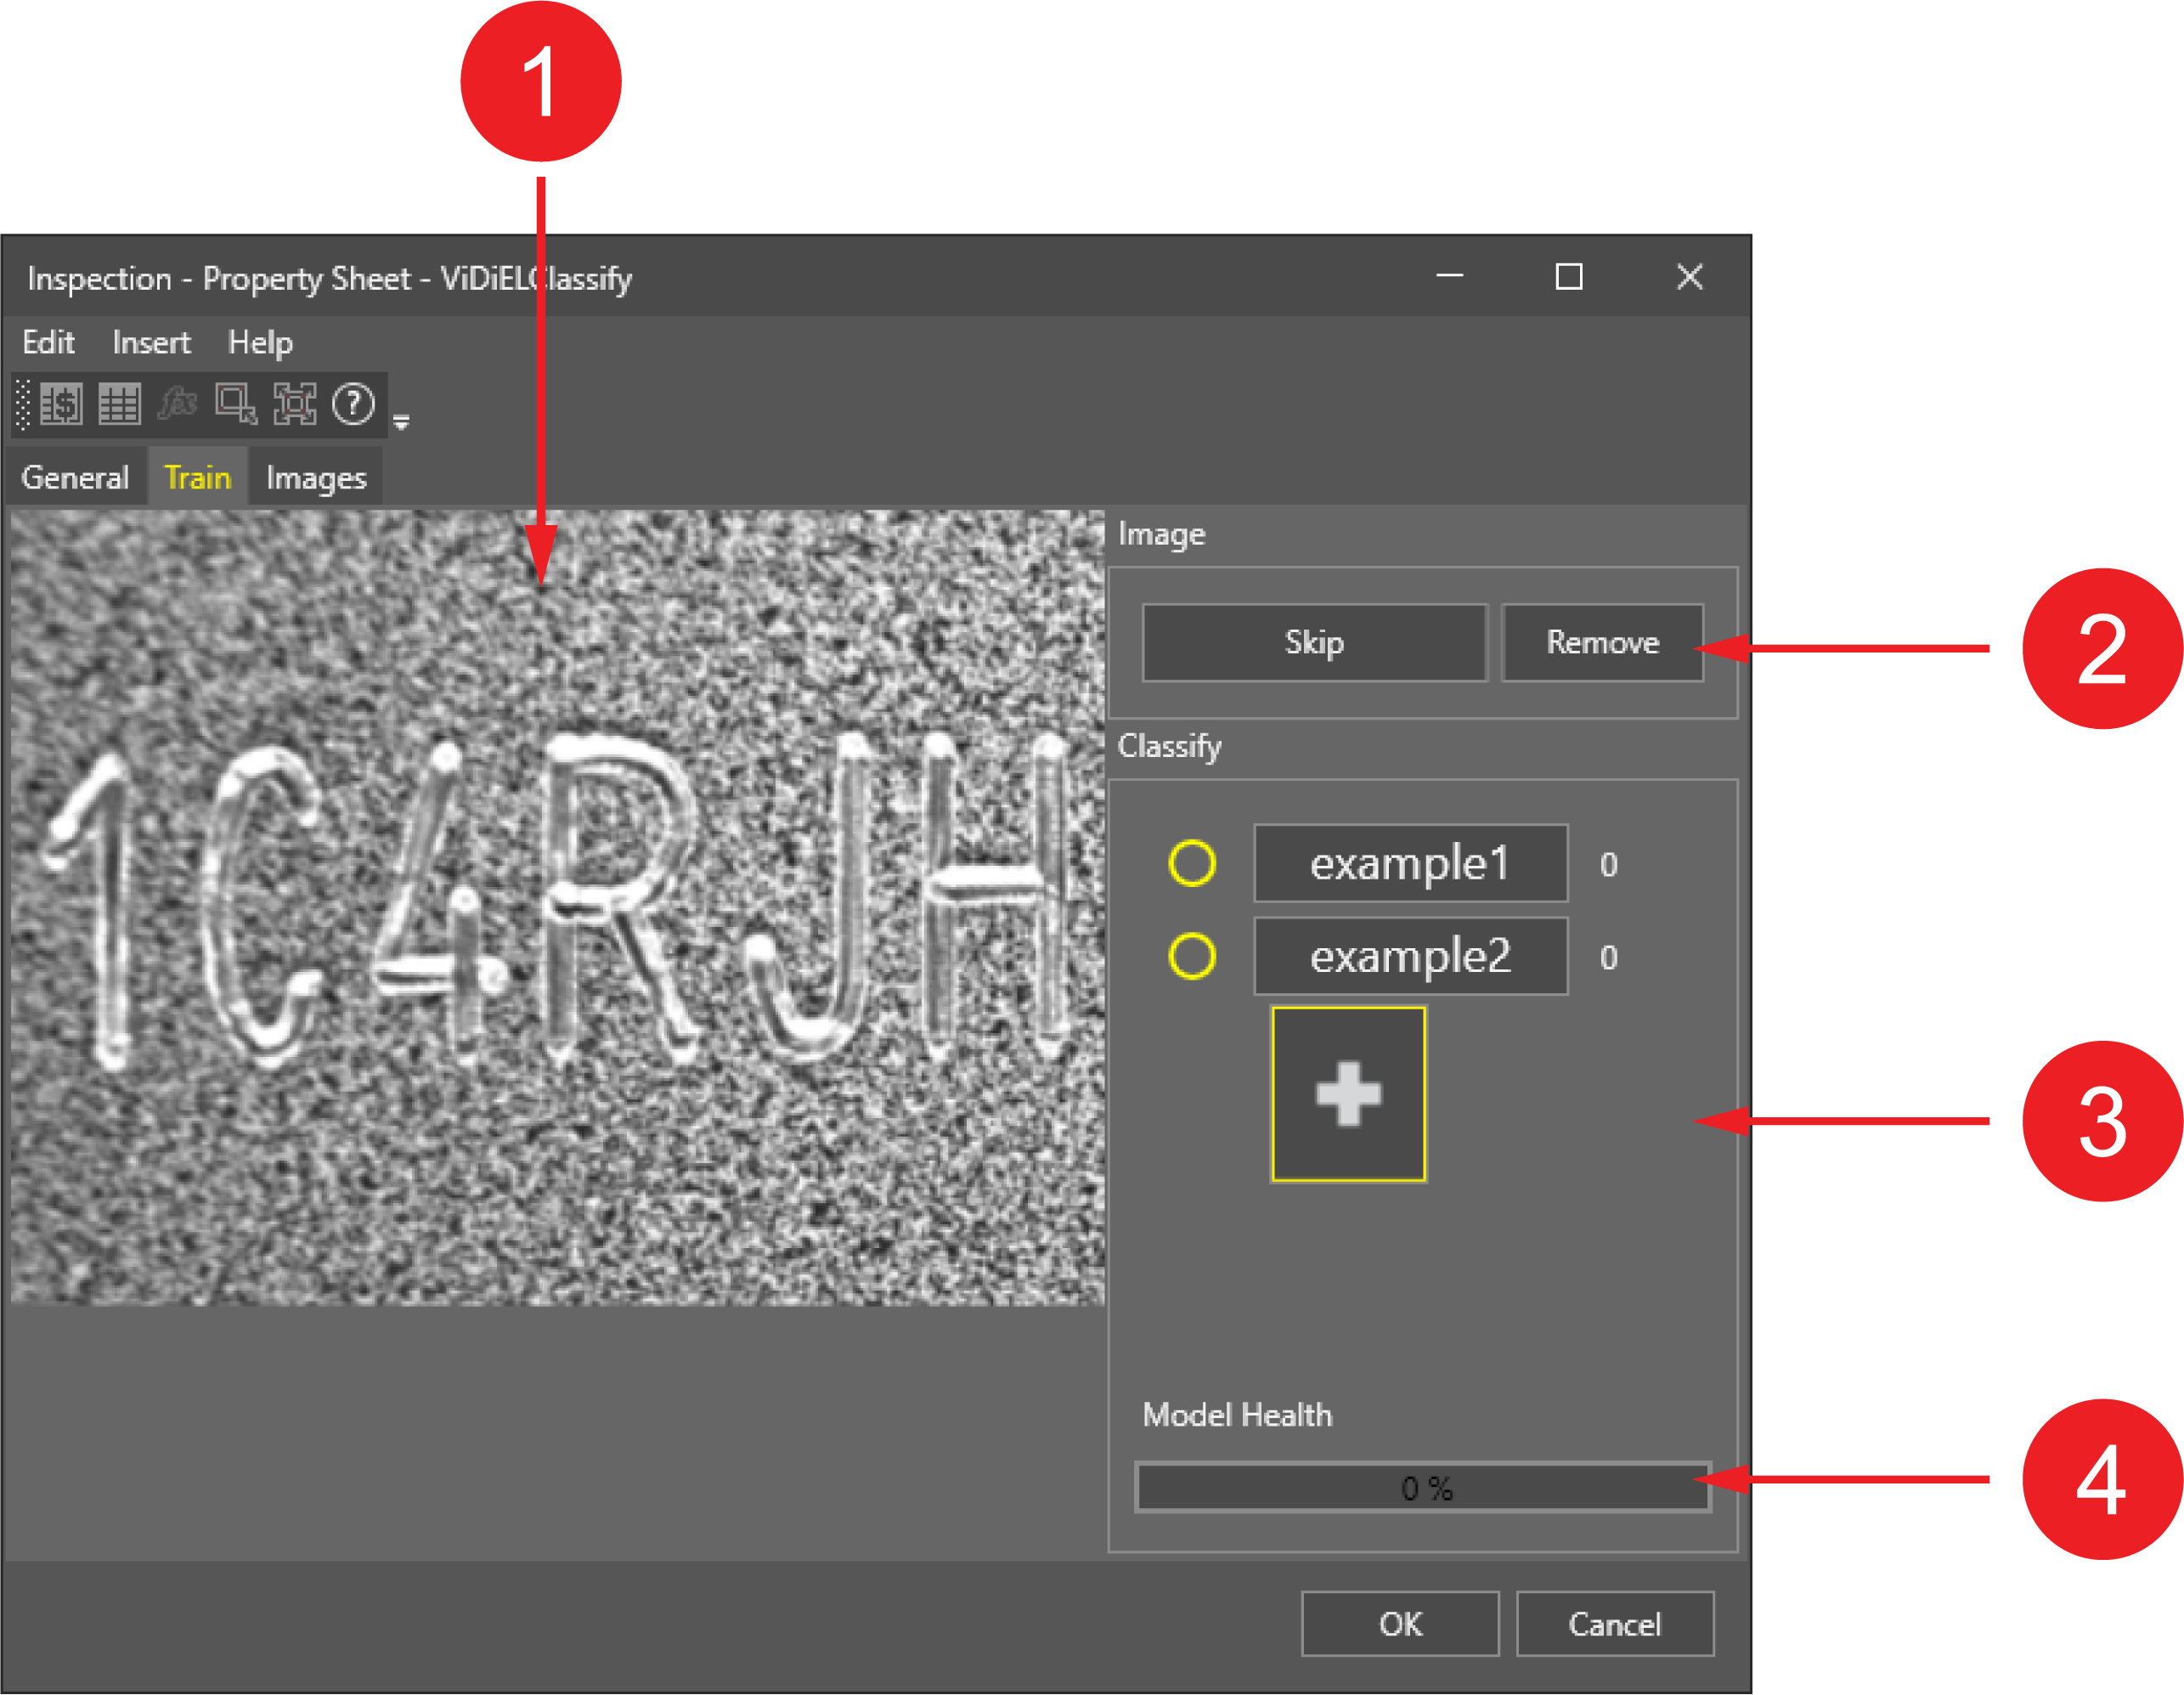
Number Component Description 1. Preview Preview of the image currently in use. 2. Image You can skip or remove an image from the collection. 3. Classify Add new classes and classify images. The yellow circles show a score ring for each class.
4. Model Health Model Health is a measure of the accuracy of the model when validated against a set of labeled images in the tool. Model health tends to increase as you add more representative images to each class.
If individual classes contain a large degree of variability from image to image, the model health may remain low, even though the tool predicts accurate results. Do not use Model Health as a hard reference for tool validation.
-
The preview section of the Train tab lists the images which you have added to your filmstrip. Using your classes, label the images.
When you label an image, the tool automatically loads the next image in the Filmstrip.
-
Now you can review your labeled images in the Image tab. Click Refresh to see all acquired data.
To learn more about the Image tab, see the table below:
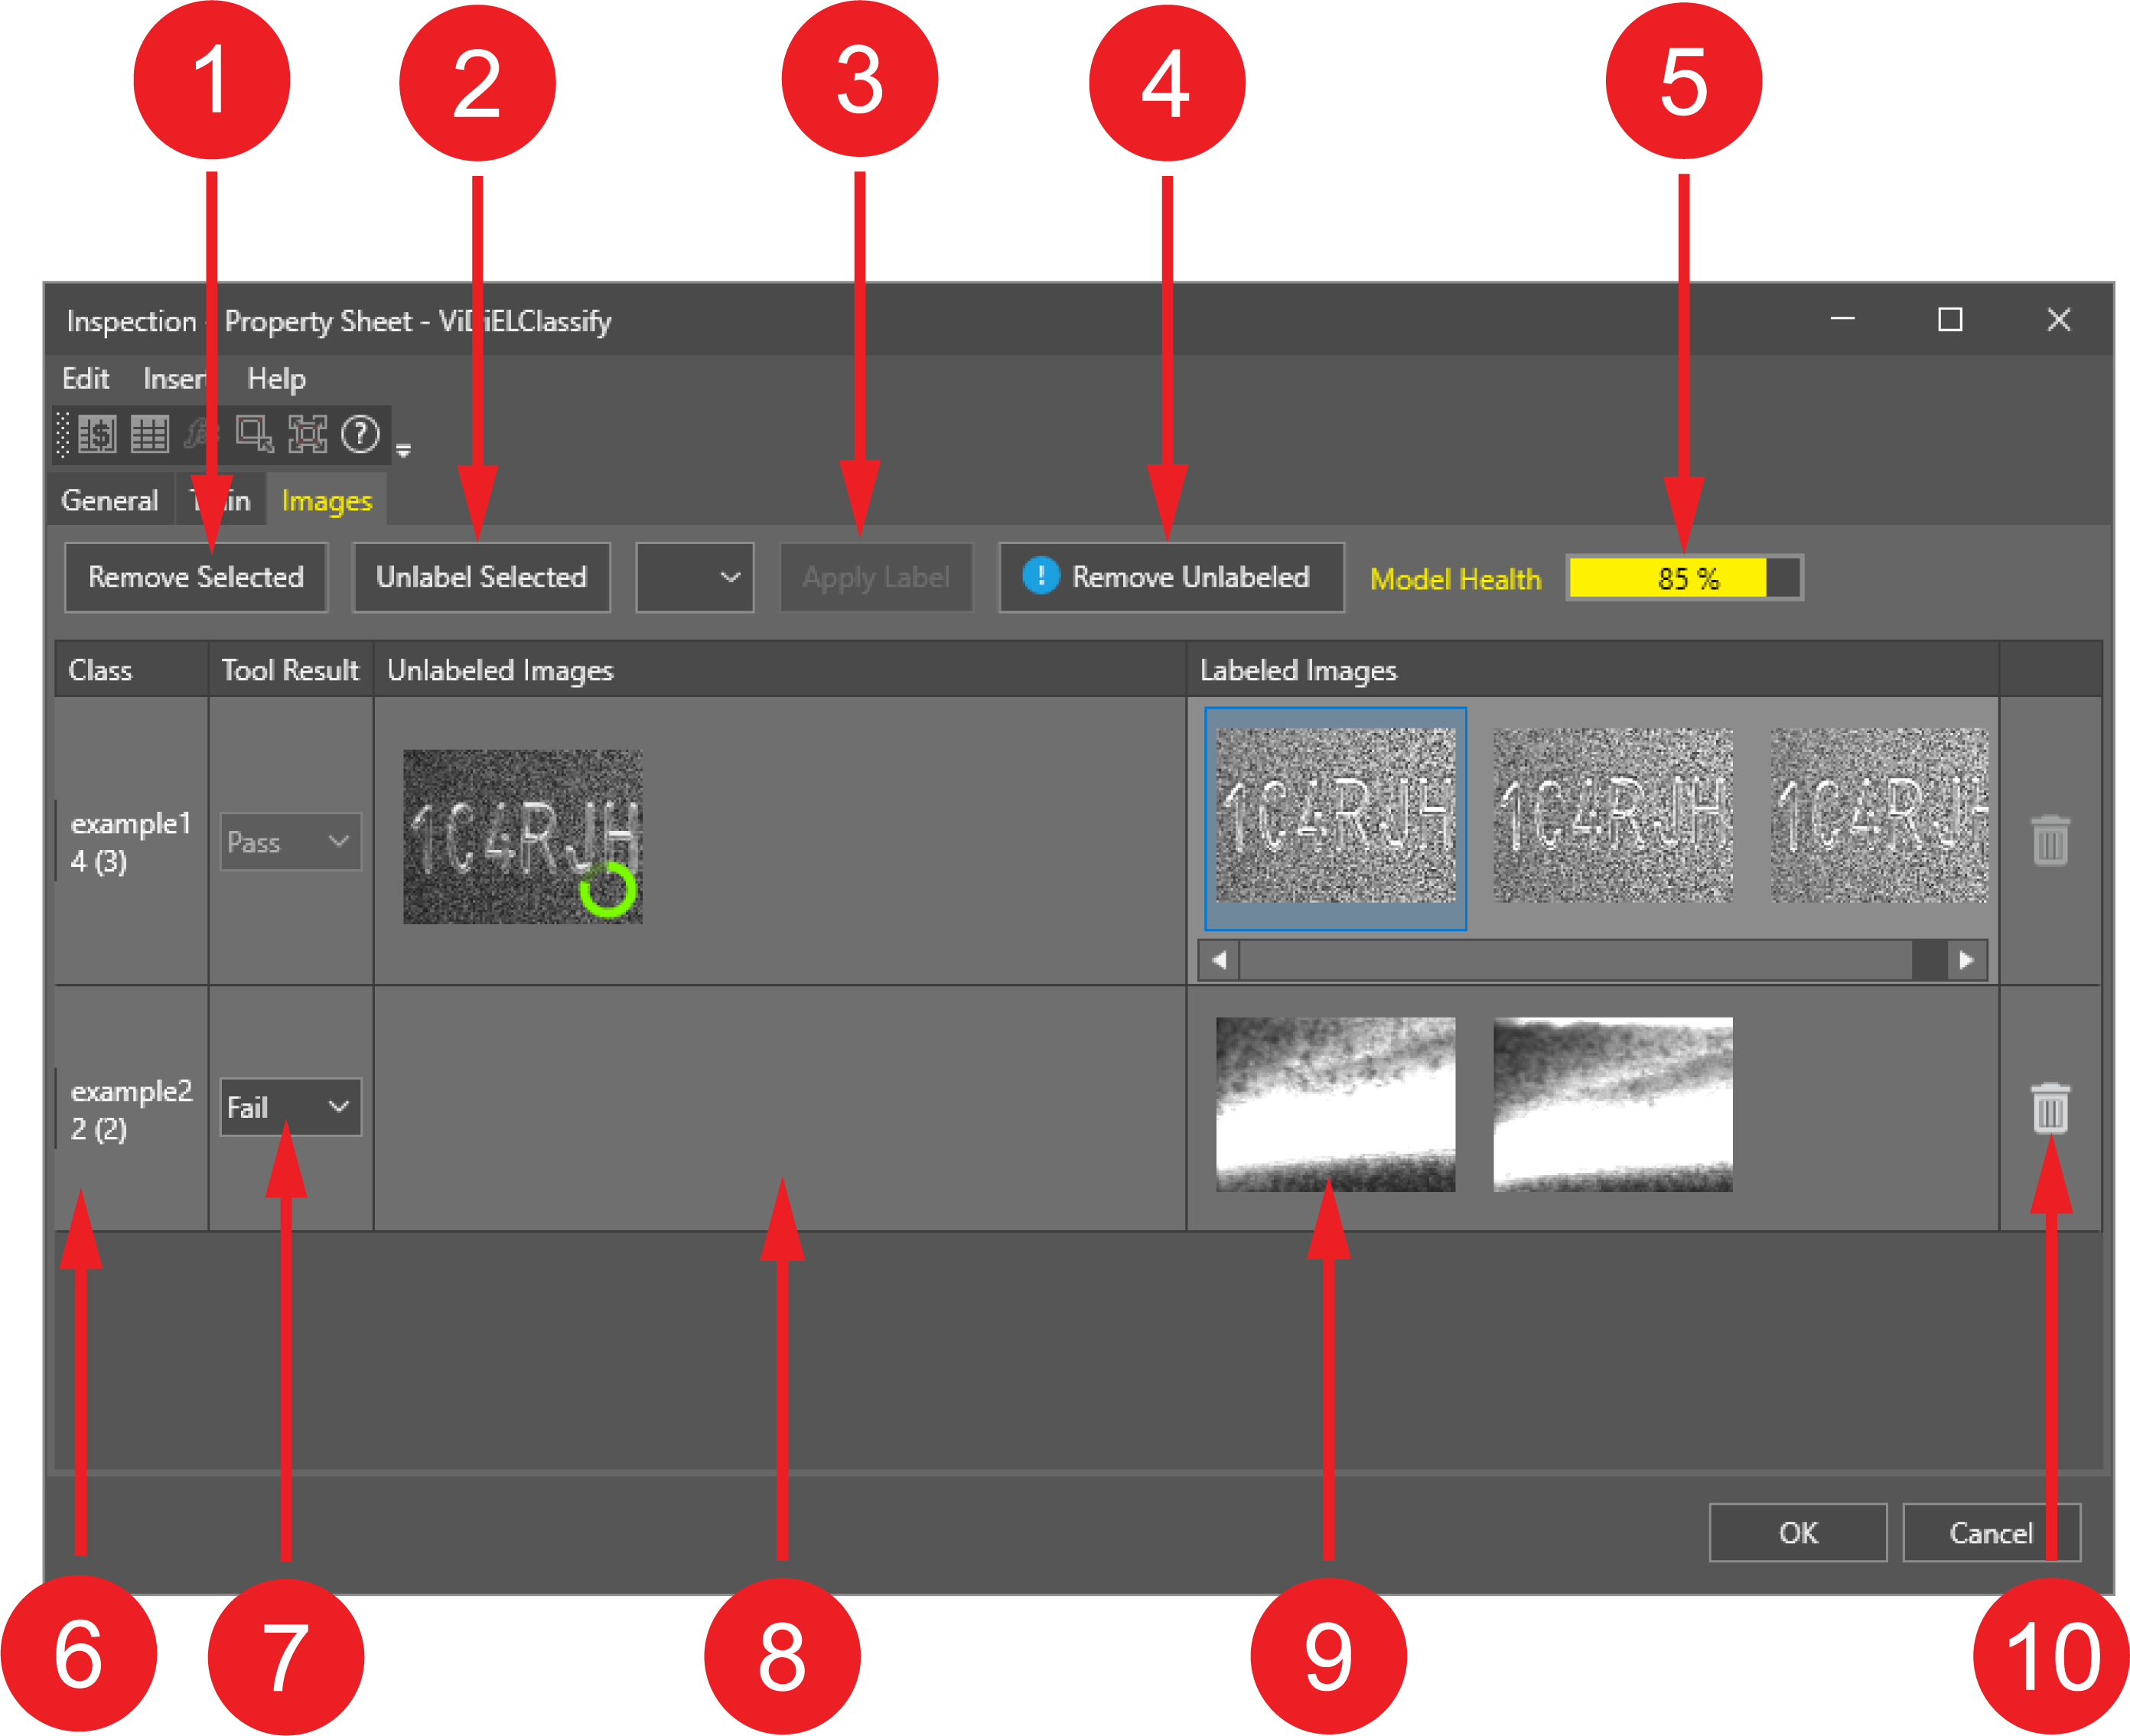
Number Component Description 1. Remove selected Remove selected images from the classification. 2. Unlabel selected Unlabel the selected, already labeled images. 3. Apply label Apply a new label to an unlabeled or a different label to an already labeled image. 4. Remove Unlabeled Remove all images from the Unlabeled Images column. 5. Model health Measure of the accuracy of the model when validated against a set of labeled images in the tool. Model health tends to increase as you add more representative images to each class.
If individual classes contain a large degree of variability from image to image, the model health may remain low, even though the tool predicts accurate results. Do not use Model Health as a hard reference for tool validation.
6. Class Shows your specified classes and the number of labeled images in that particular class. 7. Tool Results Pass:The tool passes the class with the highest score. Fail: The tool fails the class with the highest score.
Old jobs are upgraded with the ability to fail classes, but existing job results default to a pass.
8. Unlabeled images Shows the thumbnails of unlabeled images in the respective class: images that the tool predicted to belong to the respective class which you did not assign to the respective class. The tool shows a score ring on each image. Unlabeled images are sorted in order of score from lowest to highest 9. Labeled images Shows the thumbnails of labeled images in the respective class: images that the tool predicted to belong to the respective class which you assigned to the respective class. 10. Recycle bin Remove the respective class from the classification. To make the labeling and classifying process easier, you can use the following features:
-
Multi-selecting images.
-
Previewing the full image on mouse-over.
-
Dragging and dropping images.
-
- Uncheck Collect Samples on the Spreadsheet. The table updates according to the trained image data.