Use a Histogram tool to generate a distribution of pixel intensity values in your acquired images. The tool calculates basic statistical measures of the pixels in an image such as the mean and median values, standard deviation, and variance. The tool can also display a graphical representation of the image histogram highlighting individual results such as the mean and median of the histogram data.
The Histogram tool supports a user interface available in QuickBuild or your custom .NET vision application:
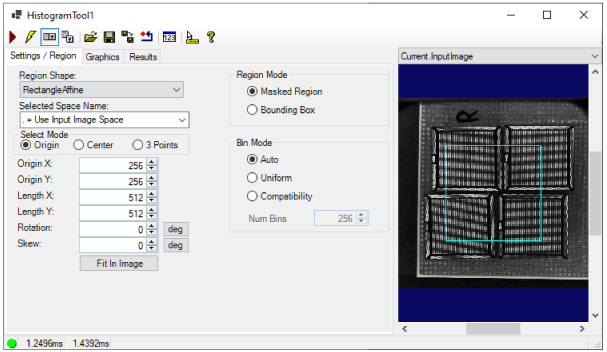
See the topic Control Reference for a description of the buttons along the top of the edit control
A Histogram tool edit control supports the following image buffers:
- The Current.InputImage provides the input images to the Histogram tool. If you specify a Region, the image buffer shows this region graphic.
- The LastRun.InputImage buffer displays the image on which the tool most recently ran. Use the Graphics tab to highlight and select the input region.
- The LastRun.Histogram contains the histogram graphic. It is the same graphic produced by calling the CreateResultGraphics function.
See the following for more information on using the Histogram user interface: