This topic contains the following sections.
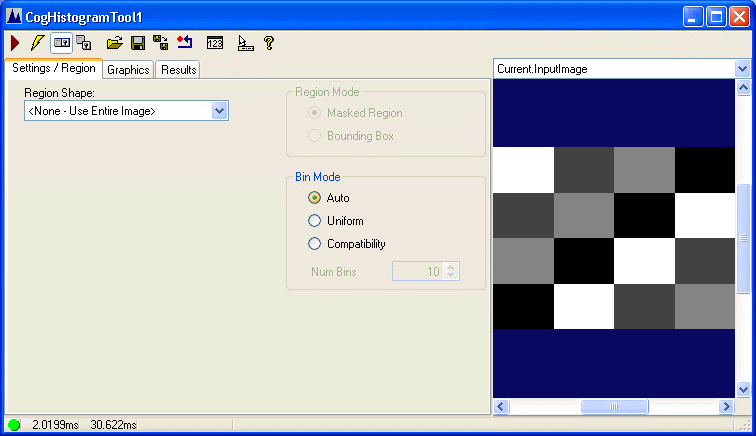
The Histogram edit control provides a graphical user interface (GUI) for the CogHistogramTool tool. The Histogram tool computes basic statistical measures of the pixels in an image such as the mean and median values, standard deviation, and variance. The tool can also display a graphical representation of the image histogram.
The Histogram edit control includes the following components:
- A row of control buttons at the top left.
- A tool display window that can display the Histogram tool image buffers: Current.InputImage, LastRun.InputImage, and LastRun.Histogram. These buffers contain the image on which the tool will operate (including any specified input region), the last image upon which the tool operated, and a graphical display of the histogram.
- A set of tabs organized by function. These functions include parameter settings to run the tool and for the input region, display settings for the tool displays, and the tool results. Pressing the Control + Tab keys scrolls through the set of tabs.
- A status bar at the bottom left of the control. A green circle indicates that the tool ran successfully; red means the tool ran unsuccessfully. The status bar also displays the time to run the tool and any error codes or messages. The first time that the status bar displays is the raw tool execution time. The second includes the time needed to update the edit control. Controls only update when they are visible.

The following table describes the buttons at the top left of the edit control.
| Button | Description |
 | Runs the Histogram tool. You must have an image available in the Current.InputImage buffer (equivalent to the InputImage). This button invokes the Run method. |
 | Toggles electric mode. When selected, the Histogram tool runs automatically if certain parameters have changed. When the edit control is in electric mode, these parameters are indicated by electric bolt icons. |
 | Opens or closes the local tool display window. This window has a selection box that you use to specify the image buffer you want to view. |
 | Opens one or more floating tool display windows, providing an additional tool display window. As with the local tool display window, you can specify the image buffer to view. |
 | Loads a VisionPro persistence (.vpp) file, which contains a set of saved properties for this vision tool object type. Loading a persistence file for another object type throws an error and the load is unsuccessful. For more information about VisionPro persistence features, see the topic Persistence in VisionPro. |
 | Saves the current properties of the underlying tool to a VisionPro persistence file. You have the option to save either the entire tool or the tool without its images or results. |
 | Saves the current properties of the underlying tool to a new VisionPro persistence file. |
 | Resets the underlying tool to a default state. |
 | Opens a new, separate results window, allowing you to view run results without turning to the Results tab. |
 | Enables or disables the display of tooltips for individual items in this edit control. |
 | Opens this help topic. |
The Histogram edit control has three image buffers. The first buffer shows the Histogram tool's InputImage, the second buffer displays the last input image that the Histogram tool ran on, and the third buffer shows the histogram graphic. All three buffers can be shown in both the local and floating tool display windows.
- The Current.InputImage provides the input images to the Histogram tool. This is the Histogram tool's InputImage buffer. If you specify a Region, the region selection graphic is shown in this buffer.
- The LastRun.InputImage buffer displays the image on which the tool most recently ran. Use the Graphics tab to highlight and select the input region.
- The LastRun.Histogram contains the histogram graphic. It is the same graphic produced by calling the CreateResultGraphics function.
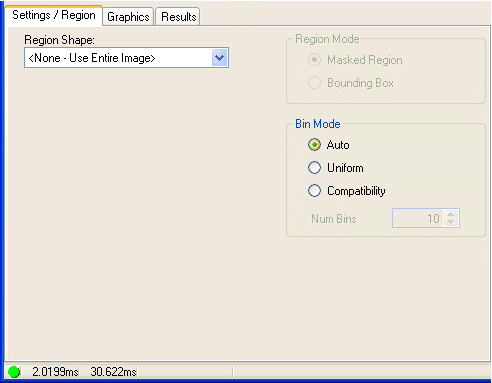
You use the Settings / Region tab to specify the input region for the tool and to set the tool's operating parameters.
| Feature | Description |
Select the shape of the input region. Selecting "None=Use entire image" means that the tool uses the entire input image. A Histogram tool supports the following input region shapes: The set of region-defining parameters that appear depend on the region shape you use. For more information on using a polygon as an input region, see the topic Using Polygon Input Regions. | |
Defines how the tool interprets the region you specify.
| |
| SelectedSpaceName | The coordinate space in which the region is interpreted. For information, see Coordinate Space Names. |
| Select Mode | Available when Region Shape is CogRectangle or CogRectangleAffine. Selects the set of parameters that define the rectangle. If cogRectangleAffine is chosen, note that the angles of rotation and skew can be specified in degrees or radians, although the underlying tool keeps the measurements in radians. |
| BinMode | Specifies how the tool processes the bins it has been configured to use. The default setting of Auto allows the tool to ignore any setting for Num Bins and use the full dynamic range of the current input image (256 bins for an 8-bit image, 1024 bins for a 10-bit image, and so on up to 65,536 bins for a 16-bit image). |
| NumBins | Specifies the size of the histogram. By default, the histogram contains one bin for each possible pixel value in the input image (256 for 8-bit grey-scale images). You can specify a smaller value, in which case pixels with values greater than or equal to the number of bins are included in the last bin. |
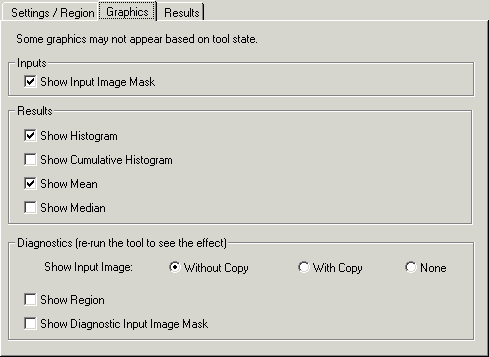
You use the Graphics tab to specify the graphics that the tool generates and displays.
| Feature | Description |
Inputs |
|
Results | Use these controls to determine which graphics are displayed in the LastRun.Histogram window. These settings are equivalent to the CogHistogramResultGraphicConstants enumerations supplied to CreateResultGraphics function.
|
Diagnostics display | Displays the following features in the LastRun.InputImage buffer. Uses the CreateResultGraphics method to generate these results.
|
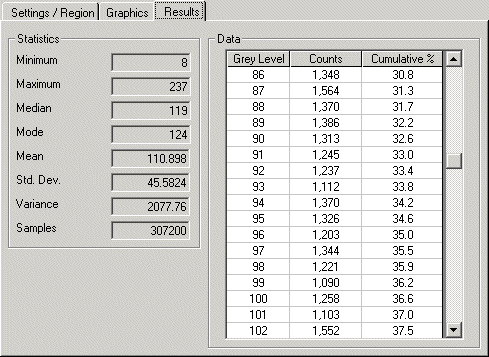
The Results tab displays the results of the most recent run of the tool. This corresponds to the CogHistogramResult interface.
| Feature | Description |
Statistics | Displays the following histogram statistics.
|
Data | Displays the following information about each bin in the histogram.
By default the number of bins in the image corresponds to the maximum possible pixel value in the image; 256 for 8-bit greyscale images up to 65,536 for 16-bit greyscale images. |