Charts
For functions that generate a chart, the chart opens in a separate, dockable Charts panel. You can open this panel through the View > Charts option of the Menu Bar.
When the Show parameter of the function Functions are tools that are available in Spreadsheet for processing and analyzing acquisitions or other results. You can add functions to your Spreadsheet job to create tool chains and produce results for specific applications. is configured to display the chart, the chart displays in the Charts
If you make changes to the function generating the chart, the chart automatically updates to reflect the change.
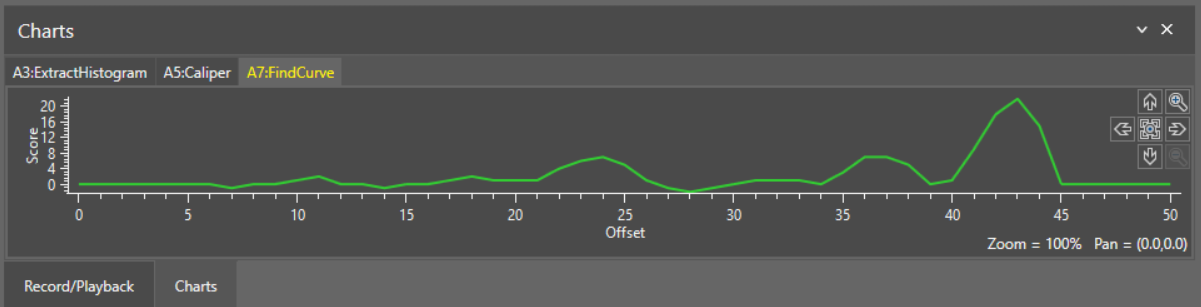
When there are multiple functions that generate charts in a spreadsheet, the functions are tabbed. Selecting the function in the spreadsheet displays the chart in the Charts
When viewing the Property Sheet of a function that generates a chart, the Charts panel only shows the chart for that function.
The following
| Function | Show parameter |
| Caliper |
|
| ExtractColorHistogram |
|
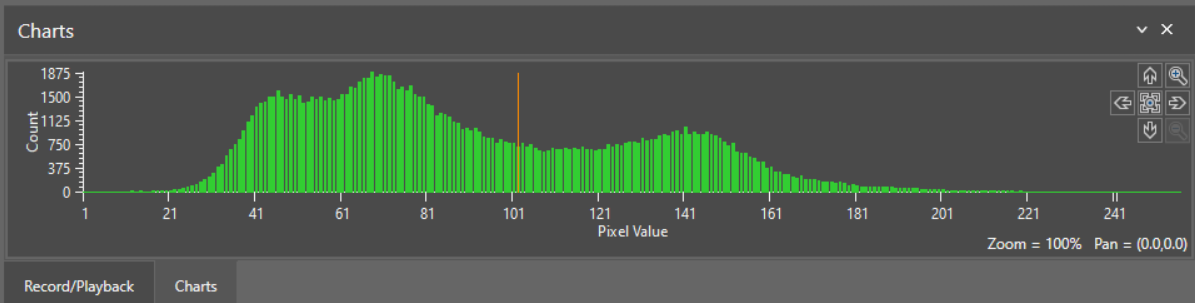
| ExtractHistogram |
|
| FindCircle |
|
| FindCurve |
|
| FindLine |
|
| FindMultiLine |
|
| FindSegment |
|
| InspectEdge |
|
| InspectEdgeTrainBeadPath |
|


