Auditing
Auditing enables the graphic display of cell dependencies within Spreadsheet Cell Execution, as well as displaying cells that have dependency errors (#ERR). A dependency exists when the expression in a cell references another cell or range of cells.
There are two parts to each dependency: a precedent and a dependent. The precedent refers to the source of the data, i.e. the cell or range of cells that a cell's expression refers to; the dependent is the destination of the data, i.e. a cell that contains an expression that refers to other cells.
Cell References in an expression constitutes exactly one dependency, with one precedent and one dependent. Each dependency is displayed as a color-coded arrow that points from the precedent to the dependent. A small circle at the end of the arrow indicates the precedent cell. The arrows for errors appear over the arrows for non-errors, and the arrows of precedents appear over the arrows of dependents.
Dependencies are drawn in the following order:
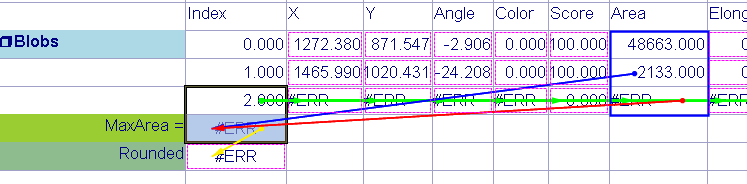
- Normal dependents = green arrow
- Normal precedents = blue arrow
- Dependents in error = yellow arrow
- Precedents
in error = red arrow
Dependencies are drawn differently for the following:
- Multiple Cell Precedents:
When multiple cells refer to a precedent, the range of cells is outlined and the arrow originates from a dot.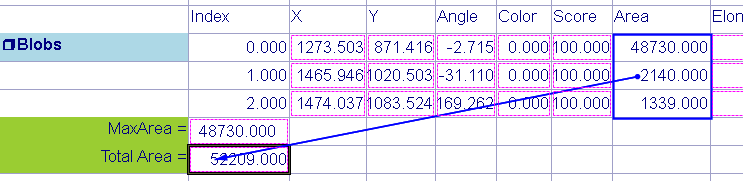
- Empty Cells:
If a cell's expression refers to an empty cell, this relationship is displayed when the dependent cell is selected but is not displayed when the empty precedent cell is selected. A red question mark is displayed in the dependent cell, regardless of which cell is selected.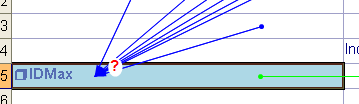
The dependent cell is selected.
- Dead-end Cells:
If a cell has no precedent references, the cell is drawn with a dashed
magenta border. The magenta border is displayed for all dead-end cells
in the spreadsheet, regardless of the selected cell(s).
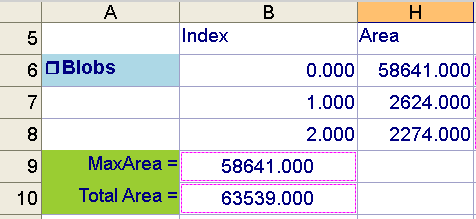
Cells B9 and B10 have no dependent references, therefore the cells are
drawn with a magenta border, regardless of which cell is highlighted.
- Any cell with a Cell Name.
- A cell containing a ColorLabel function Functions are tools that are available in Spreadsheet for processing and analyzing acquisitions or other results. You can add functions to your Spreadsheet job to create tool chains and produce results for specific applications..
- Any cell containing Image Functions function (e.g., PlotString, PlotRegion, etc.).