Use a Histogram tool to generate a distribution of pixel intensity values in your acquired images. Some vision tools make use of histograms for segmenting features of interest from background pixels.
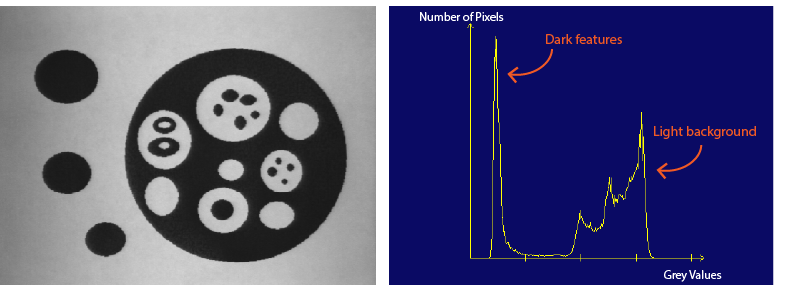
The plot of a histogram graphically represents the distribution of grey values for any image:
- The horizontal axis represents grey values beginning at zero and extending to the highest value your image format supports.
- The vertical axis represents the number of pixels that have that corresponding grey value in the horizontal axis.
A Histogram tool generates a set of results including the following:
- The arithmetic mean, or average grey value in the histogram
- The grey-level value that contains the maximum and minimum count of pixels
- The mode, or most common pixel value in the histogram
- The number of pixels used to generate the histogram
A Histogram tool can accept 8-bit images with 256 different grey values and 16-bit images with 65,536 different grey values.
See the following for more information: