This topic contains the following sections.
In order to be able to debug script code (running in QuickBuild or in your custom application) you must perform the following tasks:
- Set breakpoints in the script code where you want the debugger to stop.
- Set compilation mode to Debug.
- Attach a debugger when running the script.
Use the following programming statement to set a breakpoint where you want the debugger to enter your code:
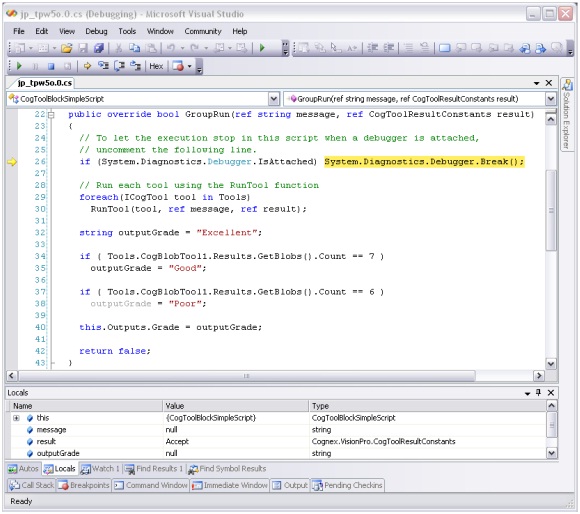
if (System.Diagnostics.Debugger.IsAttached) System.Diagnostics.Debugger.Break()
When you create new C# or VB.NET script in your Job, ToolGroup or ToolBlock, the call will be auto-generated in different places of the script code meaningful to enter debug mode. For example, if you generate a simple C# script in a ToolBlock this call will be the very first statement of the GroupRun( ) method. By default, this line of code is commented out so you need to uncomment it if you want to take advantage of this breakpoint.
When you finish with the implementation of the script code you must switch the compilation mode to Debug. This way you tell VisionPro that you want to be able to debug your script during execution so it will compile the script code accordingly.
When you set the compilation mode to Debug mode, VisionPro will compile the script code with debug information embedded and optimization turned off. This can affect the performance of your script code so you should switch back to Release mode when you are done with all the implementation and debugging you needed.
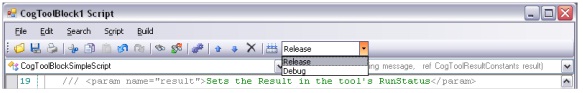
Switch between Release or Debug mode compilation by selecting one of the two options in the ComboBox located at the end of toolbar of the Script Editor form:
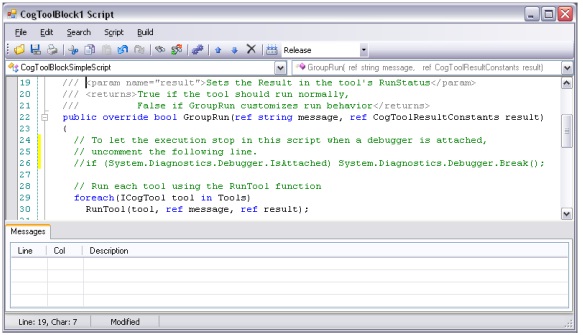
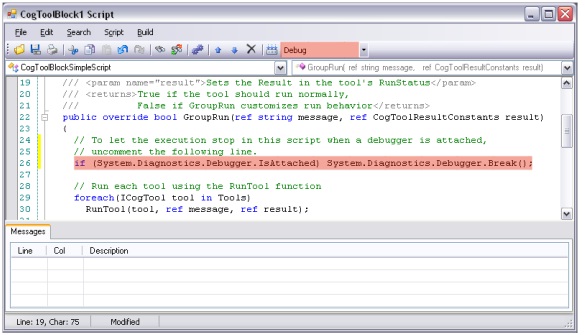
The following figure shows a script editor with breakpoint uncommented and the compilation mode set to Debug:
This section contains the following subsections.
- Debugging with the Full Version of Visual Studio
- Debugging with the Express Versions of Visual Studio
- Debugging with Visual Studio Remote Debugger
The last step is to attach a debugger to the running process that hosts the script, which is either QuickBuild or a custom application.
The method of attaching a debugger is different based on whether you are using the full version of Visual Studio or Visual Studio Express.
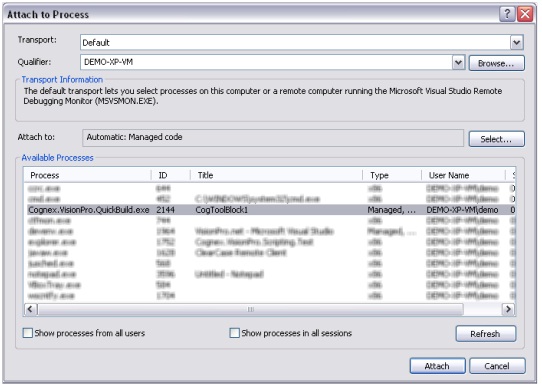
To debug your script using the full verison of Visual Studio, you need to attach the debugger to your process by selecting Tools->Attach to process..., choosing your process and clicking Attach. The following figure shows how to attach the Visual Studio debugger to QuickBuild:
At this point you can let the script run. When the execution of your script code reaches the System.Diagnostics.Debugger.Break() method call the Visual Studio debugger will enter debug mode, stop the execution at that point in the code and provide you all the usual debug options you are already familiar with from Visual Studio.
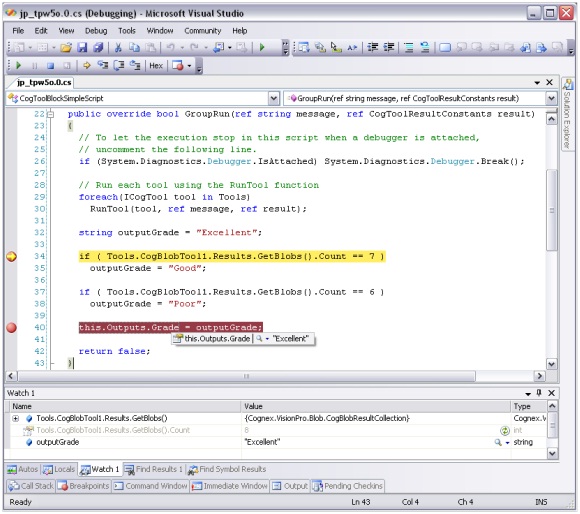
As you can see on the following screenshot you can take full advantage of Locals and Watch windows, hover your mouse over any object to explore its details and insert breakpoint to any line in the code you want.
You can control the execution of your script code line by line or let it run till the next breakpoint, just like you would debug any other Visual Studio application.
Since there is no Attach to process functionality built in to any of the Express versions of Visual Studio, follow the workaround described in this section to debug your VisionPro script code.
The difference between debugging with the full version of Visual Studio and the Express version is the attachment of the debugger to QuickBuild.
The first step is to create a project, such as a C# Console Application (or VB.NET Console Application if you are using Visual VB.NET Express). The goal is to have an empty executable project.
The next step is to make Visual C# Express (or Visual VB.NET Express) launch an external application if you Run or Debug your brand new application you just created. You need to find the project file of your application on the disk, so look for YourApplication.csproj (or YourApplication.vbproj if you are using Visual VB.NET Express). You need to manually edit the content of this file so open it in a text editor and look for the following element in the XML content:
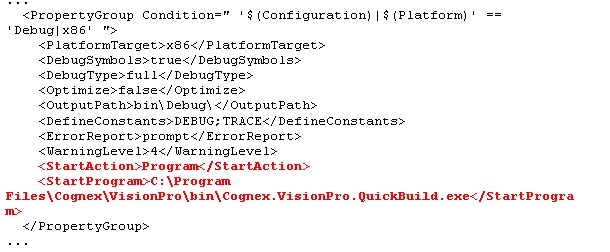
You need to include the lines marked red from the code above into your project file and save the modifications. Visual C# Express will ask you to reload the project settings file, so click Reload.
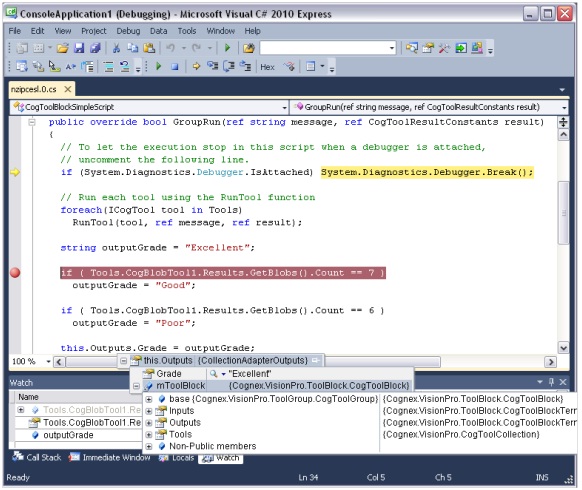
Once you hit F5 (or go to Debug / Start Debugging) you will see QuickBuild being launched and the Visual C# Express’s debugger will be attached to it. From this point on everything is the same as you were using the full version of Visual Studio. Once your QuickBuild job’s execution reaches the System.Diagnostics.Debugger.Break() method call in your script code, the execution of the process will stop and you end up in Visual C# Express where you can use all the built-in debug capabilities of the development environment. You can insert breakpoints wherever you want, use the Locals or Watch window to query your objects’ values, hover your mouse over any object in the code to explore its details and control the execution of the script code, as shown:
It is also possible to debug the script code using the Visual Studio feature called Remote Debugging. It is available only in the full version of Visual Studio so the Express versions are not supported here. Perform the following steps:
- Install the Visual Studio Remote Debugger component on the remote machine (the production machine that runs VisionPro with the script code). You can download the necessary install package from http://www.microsoft.com/download/en/details.aspx?id=475
- Install Visual Studio on your development machine (the machine which has no VisionPro installed and will be used to do the debugging).
- Configure Windows Firewall (or any other firewall you have in place) to allow the Remote Debugger to work. Detailed instructions can be found at: http://msdn.microsoft.com/en-us/library/ee126350.aspx.
- Configure the necessary user accounts on both machines. For further instructions: http://msdn.microsoft.com/en-us/library/ms164725.aspx
- Share the temporary files on the remote machine so you can access those files from your development machine (Windows sharing).
- On the remote machine run the Visual Studio Remote Debugger.
- On your development machine create an empty project in Visual Studio. In the Debug properties set the Start external program field to QuickBuild's (or any user application's) path on the remote PC (ex.: "C:\Program Files\Cognex\VisionPro\bin\Cognex.VisionPro.QuickBuild.exe") and check the Use remote machine checkbox and fill in the remote PC's name.
- Hit Run in Visual Studio and if everything is set up correctly QuickBuild (or the user's custom application) will be launched on the remote machine.
- Start the job/application (.vpp) containing the script code and let it run.
- Once the execution hits the breakpoint in the script the application will stop and Visual Studio will show the script's source along with all available debug information and you will be available to use all the debugging features of Visual Studio. Please note that you might need to point Visual Studio to the location that contains the compiled script source (especially on first run).
The Debug mode compilation of the script requires physical persistence of the source code itself and the compiled assembly along with the debug information file. Therefore a couple of temporary files get generated and stored on disk during debug compilation. There will be a subdirectory with the name VisionPro created under the system’s temporary folder and it will hold all these temporary files. The system’s temporary folder is specified by the TEMP environment variable and its default value is %USERPROFILE%\Local Settings\Temp. VisionPro will use the folder pointed by the Path.GetTempPath() .NET Framework method call to figure out the actual user's temp folder location and will create its own temp directory with the name VisionPro. It will try to clear this folder after use but it might be necessary to manually remove the temporal files from this folder to free up space on the disk.
Once you are done with the development, testing and debugging of your custom script, make sure to set the compilation mode of your script to Release mode. Otherwise your compiled script will not be optimized and will contain all the debug information that might affect the performance of your script and application.