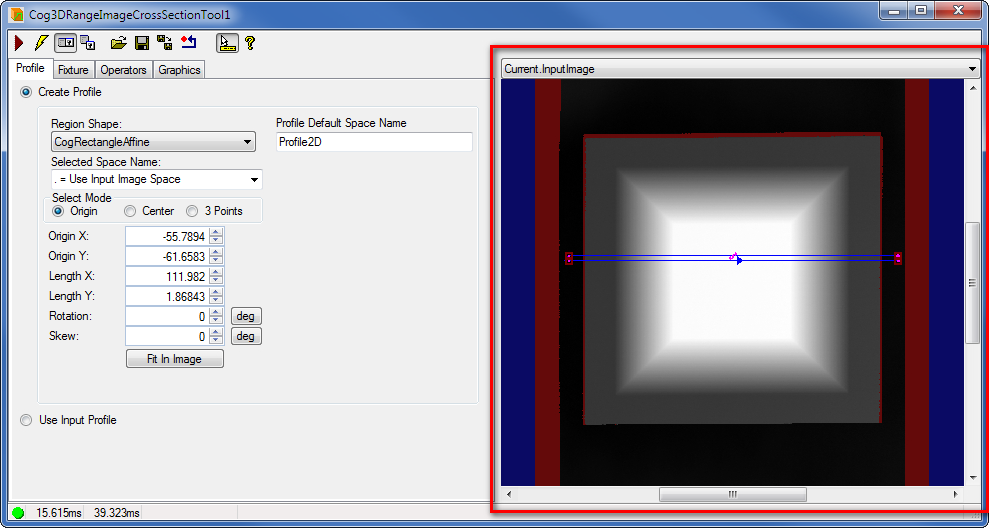
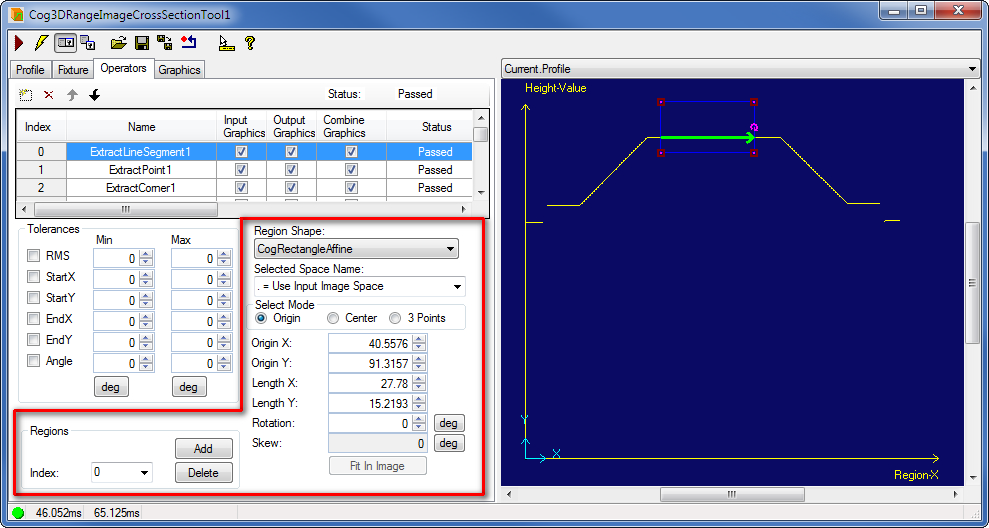
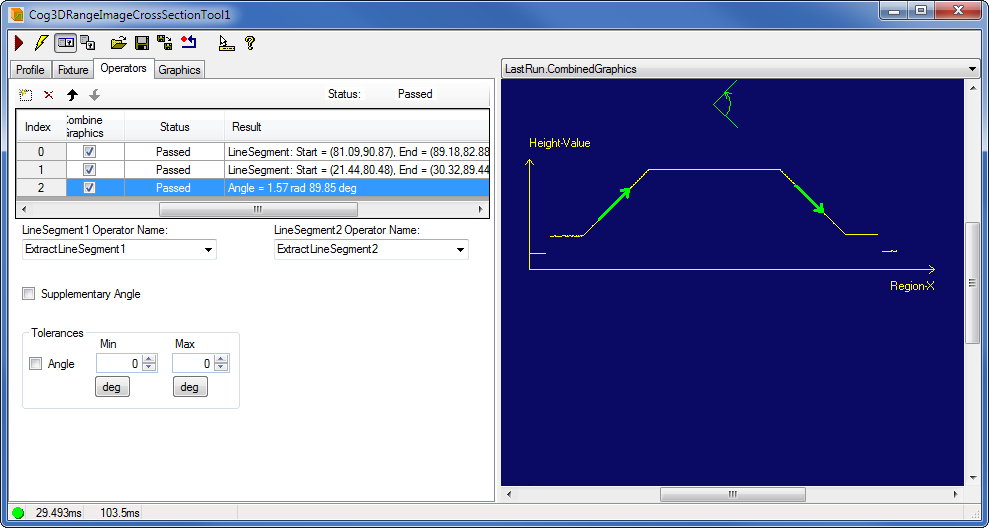
The 3D Range Image Cross Section edit control provides a graphical user interface to the Cog3DRangeImageCrossSectionTool vision tool, which creates a profile of a 3D range image and supports a variety of operators for analyzing the height-profile information it contains. The following figure shows the 3D Range Image Cross Section edit control after several operators have analyzed the profile:
The tool returns a Cog3DRangeImageCrossSectionProfile object containing the profile data and the results of all the operators that have analyzed it.
The edit control supports the following features:
The following table describes the function of each button:
| Button | Description | Function |
 | Run | Uses the Region to analyze the image stored in the Current.InputImage buffer to extract the profile and perform the measurements on the profile using the operators you specify. |
 | Electric mode | Toggles electric mode, where the Range Image Cross Section tool executes automatically when particular configuration parameters change. In electric mode, a lightning bolt appears next to every electric property. |
 | Local image display | Opens or closes the local image display window. A Range Image Cross Section tool supports the following image buffers: |
 | Floating image display | Opens one or more floating image windows, which support the same image buffers as the local image display window. |
 | Open | Opens a VisionPro persistence (.vpp) file that contains a set of saved properties for this vision tool object type. VisionPro reports an error if you try to open a .vpp file for another object type. |
 | Save | Saves the current properties of the vision tool to a VisionPro persistence (.vpp) file. The edit control allows you to choose between saving the vision tool with or without its image buffers and tool results. |
 | Save As | Saves the current properties of the vision tool to a new VisionPro persistence (.vpp) file. |
 | Reset | Resets the vision tool to its default state. |
 | Show ToolTips | Enables or disables the display of tooltips for individual items in the edit control. |
 | Help | Opens this VisionPro online help file. |
Manually specify the Region based on which profile creation is performed in the Current.InputImage record.
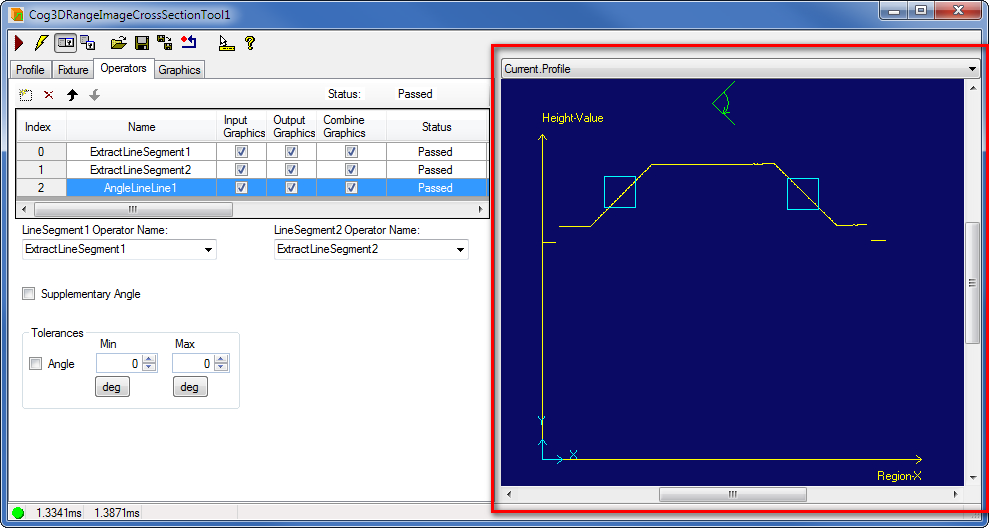
The Current.Profile record displays the profile and the operator graphics. Use this record to manually adjust the regions for the profile features you want to extract. This record also shows the result of the operator you select from the list of operators. The result graphic is displayed in green when the operator status is Passed and in red when the operator status is FailedTolerance. Note that for each operator you can turn on or off whether the operator region and result should be displayed. The profile selected space is also displayed in this record in a non-interactive mode.
Use the Profile tab to configure the source of the profile the tool should use. Choose either to create the profile based on the input range image and the Region you specify or to use an input profile already created by another Cross Section tool.
Note: When you choose to use an already extracted input profile, even though the input profile contains all data you need to perform measurements on it, you must still supply to the tool the range image from which you extracted the profile to enable fitting the measurement results back on the range image. The following figure shows the default Profile tab: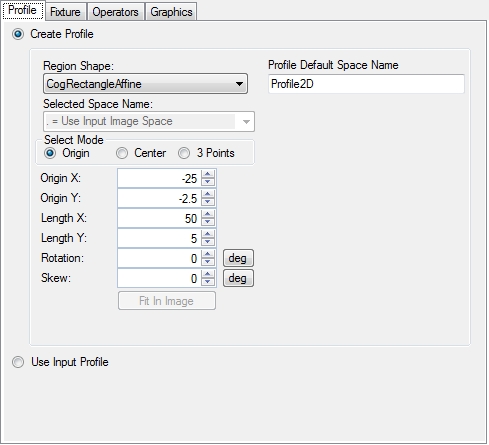
| Feature | Description |
Region Shape | Selects the shape of the Region within which the Range Image Cross Section tool will use the image data to create the profile. Points outside of this Region will not be considered during profile creation. You can select one of the following shapes:
Adjust the various properties of the Region with the shape you selected. |
| ProfileDefaultSpaceName | Sets the name of the default coordinate space of the profile to be created. Note that this setting becomes effective once you have run the tool and it is enabled only when you choose to create a profile. The default is Profile2D. |
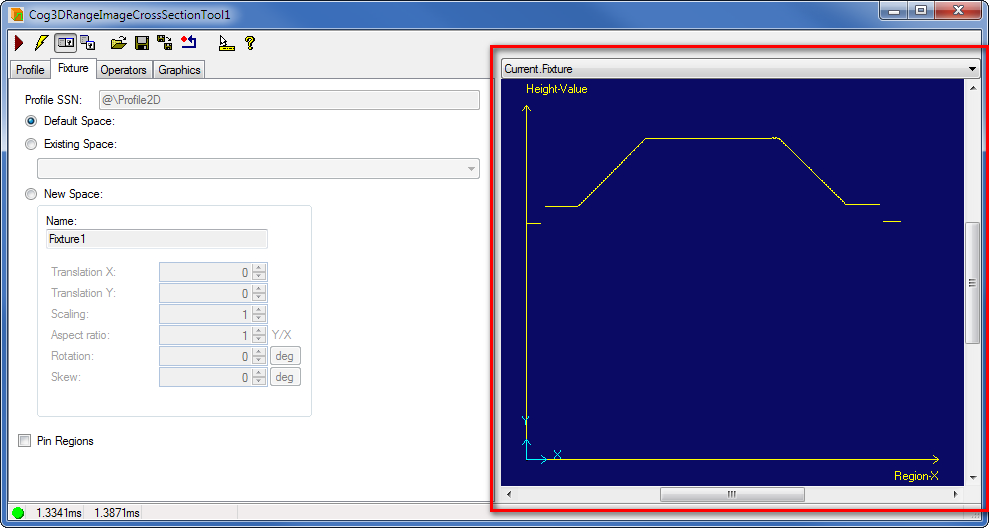
Use the Fixture tab to select the profile coordinate space of your needs. The profile data will be expressed at runtime in the profile coordinate space you specify. This space becomes the selected space of the output profile. The results of the Cross Section operators are also reported in this space. The fixturing process creates an output profile that is identical to the source profile (either created by extraction from a range image or an already existing profile selected as input profile) except that it has the selected space you specify, which may be different from the selected space of the source profile. The selected space name is shown on the tab as the Profile SSN.
The following figure shows the default Fixture tab: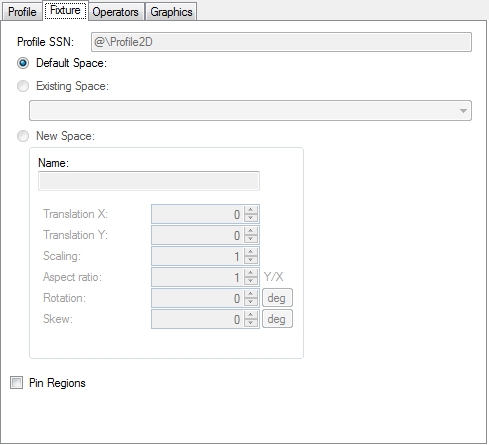
Select the Current.Fixture record on the image display to view the alignment of the profile coordinate space you selected. Manually, you can adjust your profile coordinate space in the Current.Fixture record. The following figure shows a non-default profile space selected.
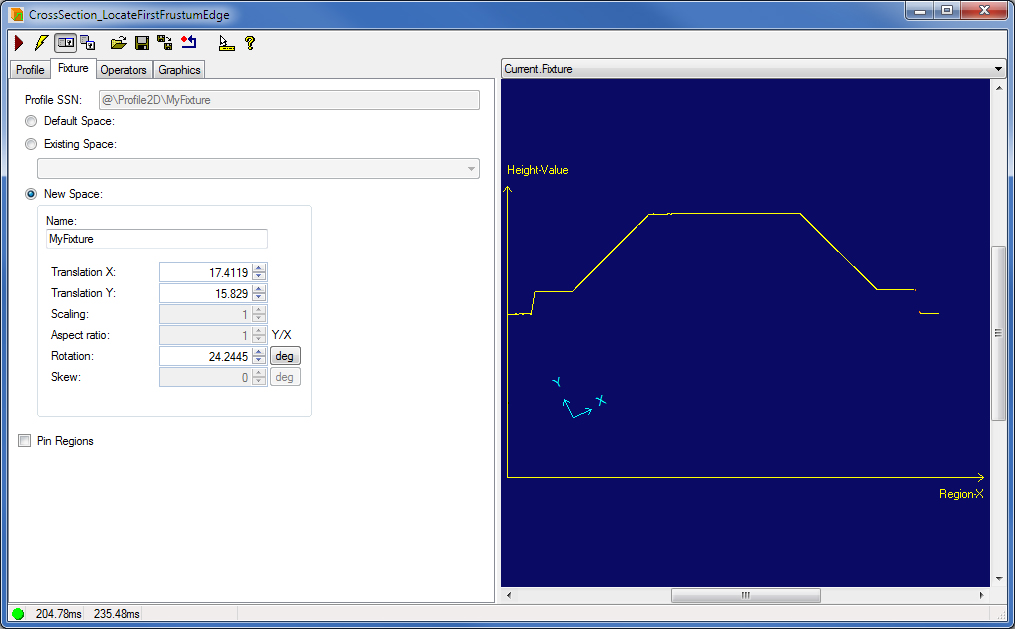
You can set the following parameters for the profile space.
| Feature | Description |
Selected space | Selects the profile space to be used at runtime and in the output profile. You can select one of the following spaces:
|
| Pin Regions (PinRegions) | This allows you to pin the profile regions specified in the operators to their current location while you are changing the profile space selection or the new space transform. The profile regions with the default selected space name equal to "." will be updated. The profile regions with any other selected space name will not be pinned, updated, or modified. The PinRegions applies only during the setup of the Cross Section tool, it is ignored at runtime. This property is only used by the control; the programmatic interface ignores this property. |
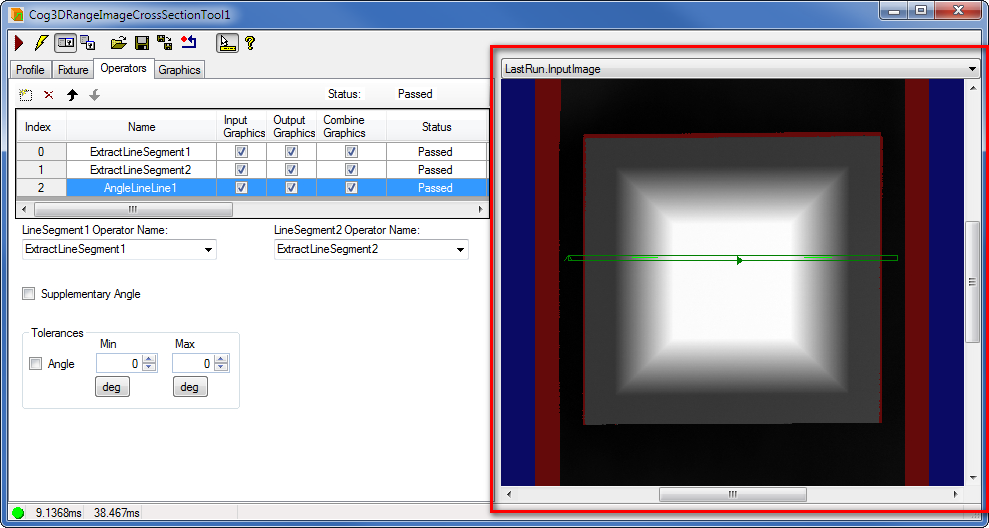
Use the Operators tab to create and configure the operators that you want to use to make measurements on the profile:
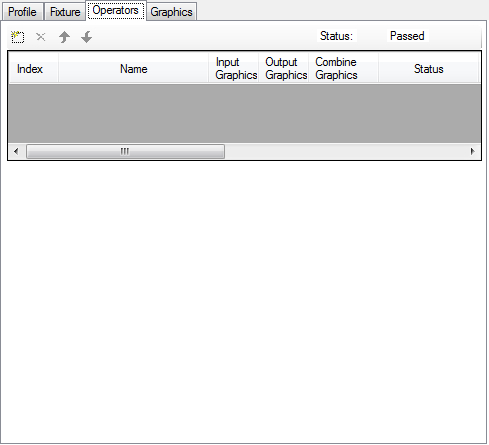
Use the function buttons shown in the following figure to add, delete and reorder the items in the reference table:

Operators are executed in the order they are listed, specified by their Index.
The following table describes what each button does:
| Button | Description |
 | Add a new operator and define an operator region on the Current.Profile display. |
 | Remove the selected operator from the reference table. |
 | Index of the selected operator up one position in the reference table. |
 | Index of the selected operator down one position in the reference table. |
For each operator, you can:
- Show or hide the feature regions used in the operator in the Current.Profile record.
- Show or hide the operator's result in various records.
- Show or hide the operator's result in the LastRun.CombinedGraphics record. Note that you have to rerun the tool for this setting to take effect.
- View the Status of running the operator, that is, whether it has passed or failed. Also, if it failed, then why.
- View the Result of running the operator.
The following figure shows an example of some operators configured and run successfully on the Operators tab.
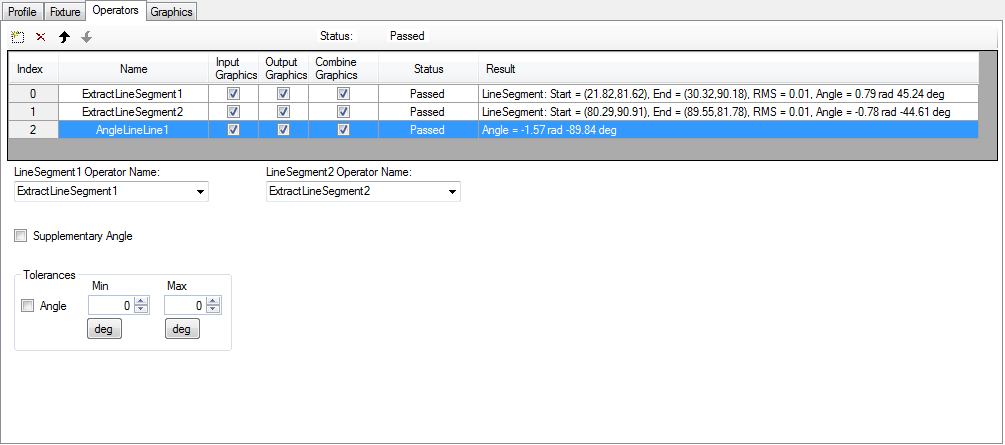
The Status of each operator is Passed and the Result contained in each operator is shown. The overall (Passed) Status of the operators is shown above the operators. If one or more operators fail, the overall Status will be Failed.
The failures reported by an operator can be one of the following:
- FailedTolerance: The operator ran but one or more of the tolerances failed.
- FailedToMeasure: The operator ran but failed to produce a measurement.
- FeatureNotExtracted: The operator ran but failed to extract a feature.
- FeatureNotComputed: The operator ran but failed to compute a feature.
- InputFeatureMissing: The operator ran but one or more of its input operators were not found.
- NotRun: The operator has not been run.
Note that the angle minimum and maximum values are always stored in radians in the tool, but in the edit control you can work with the values in degrees as well.
The 3D Cross Section tool supports the following operators:
Extract operators | |
Compute operators | |
Measure operators |
Extract operators analyze portions of the profile enclosed within a region you specify.
| Feature | Description |
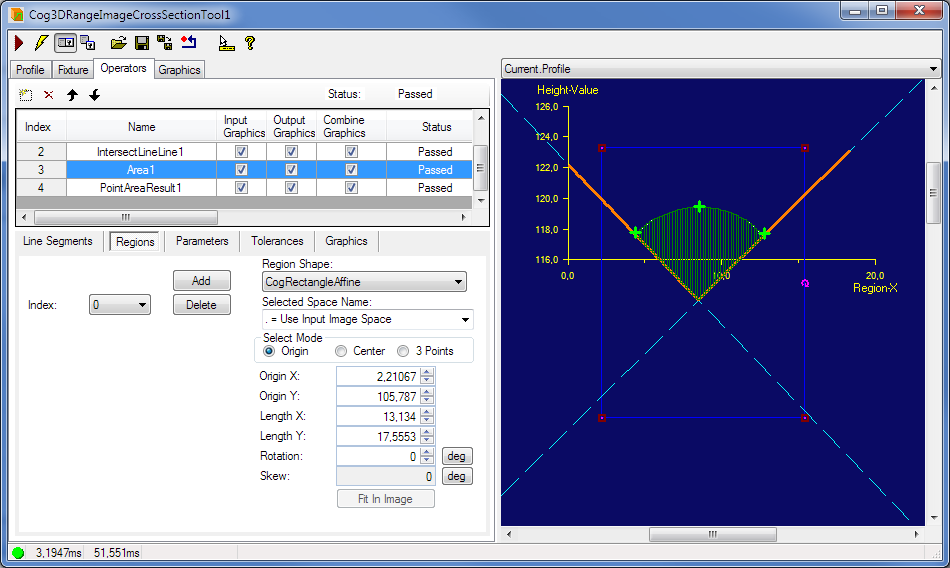
| Regions | You can specify one or more regions for the operator. You can browse the regions using the Index. You can Add a new region and Delete the one the Index is currently referring to. Select the shape of the input region. Only the CogRectangleAffine is supported currently. |
| SelectedSpaceName | The coordinate space in which the operator region is interpreted. Note that the SelectedSpaceName is from the ProfileSpaceTree and not the image CoordinateSpaceTree. For information, see Coordinate Space Names. |
| Select Mode | Selects the set of parameters that define the rectangle. If CogRectangleAffine is chosen (currently available only), note that the angles of rotation and skew can be specified in degrees or radians, although the underlying tool keeps the measurements in radians. |
Note that fitting the region in the image is not available for the operator regions because the profile is a graphic record and not an image.
The ExtractLineSegment operator extracts a line segment from the profile contour points within the region(s) you specify.
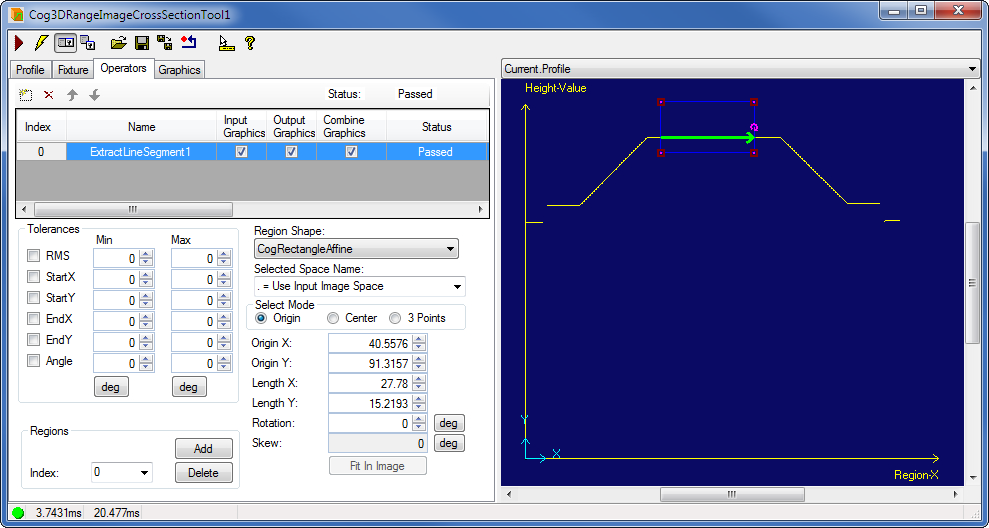
- RMS - the root mean squared perpendicular error between the line and all of the points in the region
- StartX - X coordinate of starting point of the line segment
- StartY - Y coordinate of starting point of the line segment
- EndX - X coordinate of ending point of the line segment
- EndY - Y coordinate of ending point of the line segment
- Angle - angle of line segment
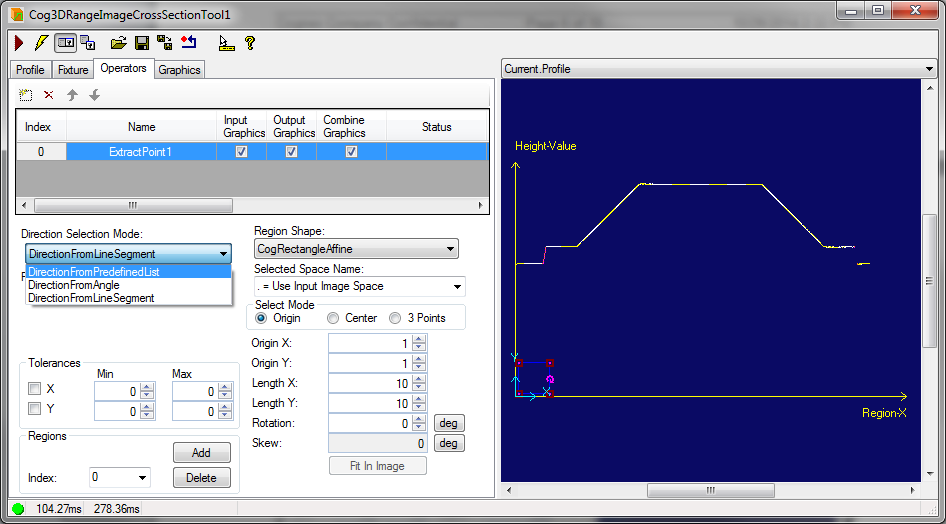
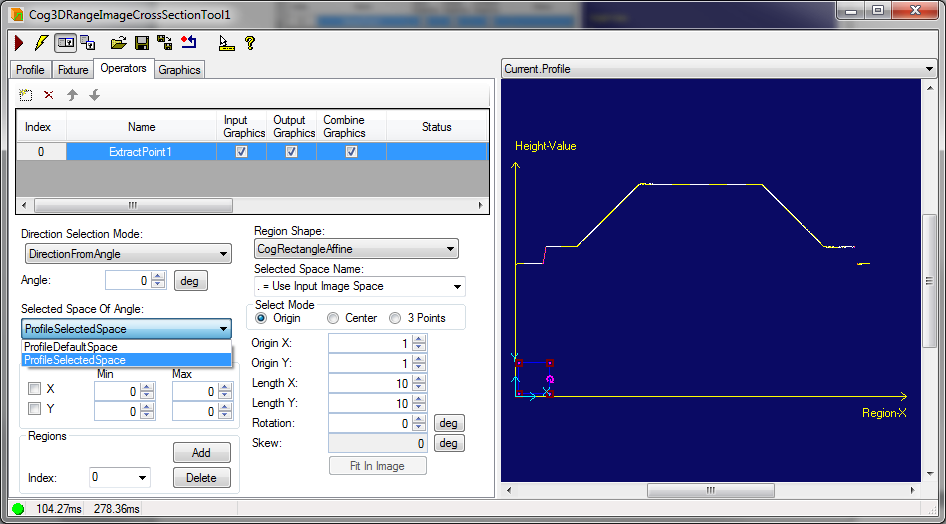
The ExtractPoint operator extracts a point from the profile contour points within the region(s) you specify. The ExtractPoint operator has three usage modes (Cog3DRangeImageCrossSectionExtractPointDirectionSelectionModeConstants):
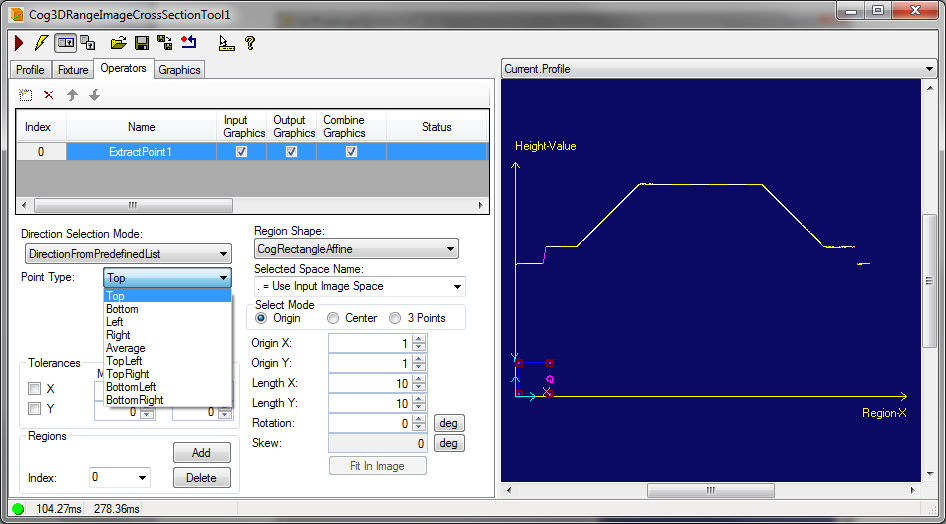
DirectionFromPreDefinedList - the user can select the direction of extraction from a predefined list of points.
The PointType can be one of the following:
- Top - extracts the topmost point, that is, the point with the highest Y coordinate
- Bottom - extracts the bottommost point, that is, the point with the lowest Y coordinate
- Left - extracts the leftmost point, that is, the point with the lowest X coordinate
- Right - extracts the rightmost point, that is, the point with the highest X coordinate
- Average - extracts the average point, that is, the average position of all points within one or more profile regions
- TopLeft - extracts the point with the lowest X and the highest Y coordinates
- TopRight - extracts the point with the highest X and highest Y coordinates
- BottomLeft - extracts the point with the lowest X and the lowest Y coordinates
- BottomRight - extracts the point with the the highest X and the lowest Y coordinates
- X coordinate of the point
- Y coordinate of the point
When the mode is set to DirectionFromPredefinedList, the user can select the direction of extraction from a predefined list of points:
DirectionFromAngle - This gives the most freedom and flexibility to advanced users. In this mode, the user can specify an angle in radians and specify whether that angle is given in ProfileDefaultSpace or ProfileSelectedSpace (Cog3DRangeImageCrossSectionSpaceSelectionConstants). ProfileDefaultSpace represents the profile’s default coordinate space while ProfileSelectedSpace represents the profile’s selected coordinate space. .
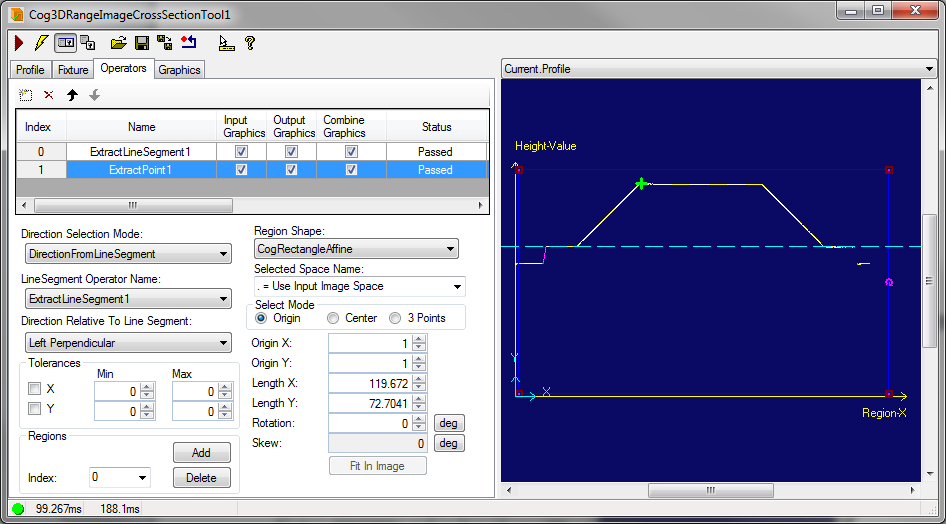
DirectionFromLineSegment - The ExtractPoint operator uses a line segment as the baseline for specifying the direction of the extraction. Besides specifying the base line, the user would need to specify the direction with respect to the base line (Cog3DRangeImageCrossSectionExtractPointLineSegmentDirectionConstants):
- AlongLineSegment - Along the baseline (0 degrees)
- OppositeOfLineSegment - Opposite to the line segment’s direction (180 degrees)
- LeftPerpendicular - Left perpendicular (90 degrees)
- RightPerpendicular - Right perpendicular (270 degrees)
An ExtractCorner operator returns a point representing a Corner from the profile of 3D range data.
The ExtractCorner operator can process a 3D profile using one algorithm to locate clearly visible peaks and valleys:
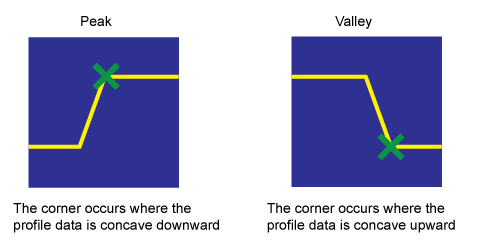
The operator supports a second algorithm to locate corners represented by features such as the corner at the edge of a step, the corner at the edge of a gap, and so on:
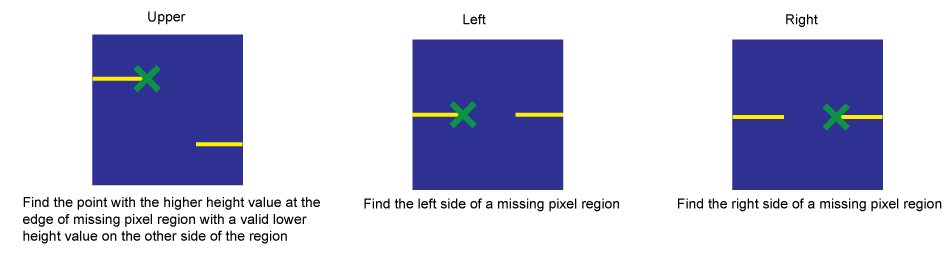
See the Remarks section in the documentation for Cog3DRangeImageCrossSectionExtractCornerV2 for a description of the algorithm the ExtractCorner operator uses to locate corner points. In addition, the class supports three additional advanced parameters in the API to allow you to fine tune the search:
The default minimum distance to interpret a gap between two profile points is 0.5mm along the Region-X axis of the ProfileSelectedSpaceName. Be aware that end points with a large difference along the Z-axis might not be considered a gap.
- StopLineFitAtGap
- LineFitValidPointFraction
Configure the following parameters to find the right corner for your vision application:
Corner Properties
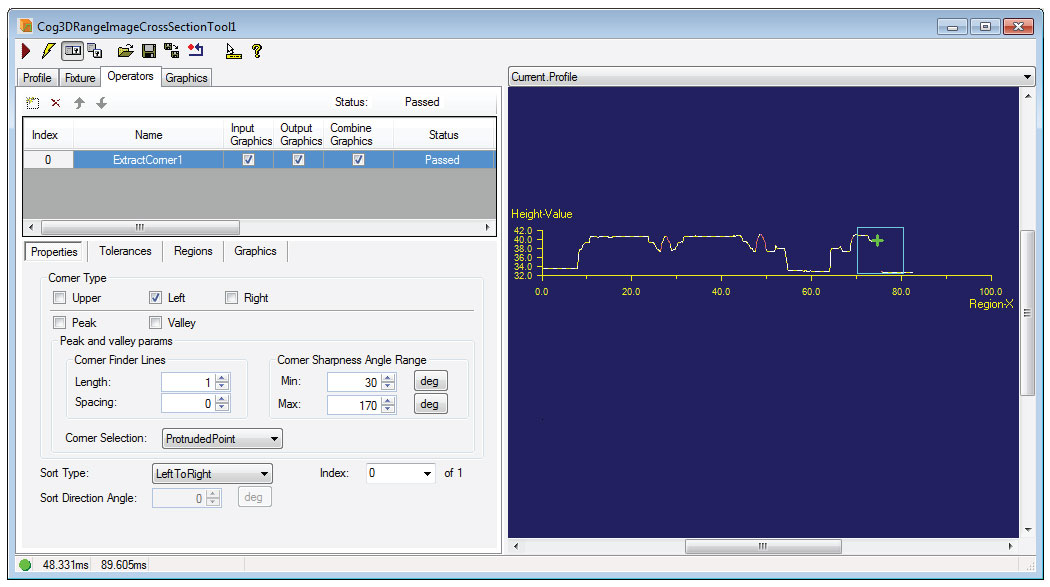
Use the Properties tab to define the parameters that locate the desired corner in the input region:
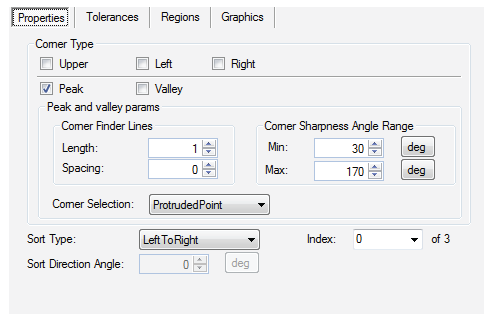
The tab supports the following:
Type of Corner
Check the type of corner (CornerType) you want the tool to locate:
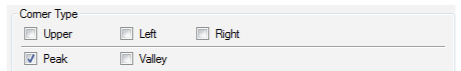
The corner types Upper, Left and Right require no additional settings but you have the option to select any combination of corner types that the operator should look for.
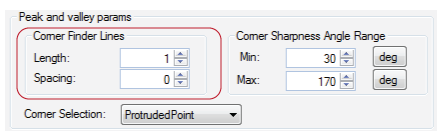
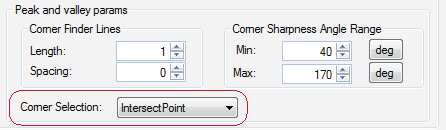
Peak and Valley Parameters
If you are using the ExtractCorner operator to locate Peak or Valley corners, the tool offers additional parameters that affect the corner-finding algorithm:
Corner Finder Lines
To locate peaks and valleys, the ExtractCorner algorithm evaluates the shape of the profile using two line segments separated by a space:
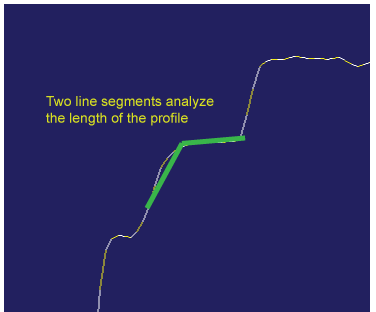
As the line segments move along the profile the angle between the line segments is measured and a corner is identified when the angle meets specified thresholds. The operator uses default values for the Length (LineFitLength) of the line segments and the Spacing (LineFitSpacing) between them:
By increasing (or decreasing) the length of the line segments and the spacing between them you can modify the number and location of found corners. For example the following figure shows how the locations of peak corners change from modifying the Length parameter:
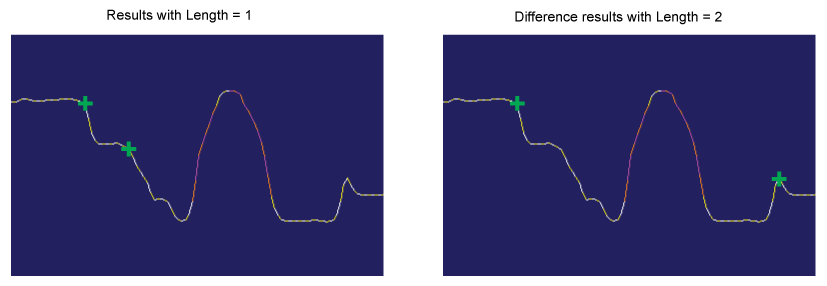
The Graphics tab allows you to enable graphics for the length of the line segments and the spacing between them, to show you how the algorithm places the line segments and the spacing between them.
Increasing the value for Length smooths the sharpness plot and removes some of the corners in the input region from consideration, while increasing the value for Spacing expands height data and can make it easier for the operator to locate corners. When you add an ExtractCorner operator to your application you might need to experiment with the values for Length and Spacing to find the desired corners for your application. Be aware the tool will generate a runtime error if the value of Length once converted to pixels is less than 2 pixels.
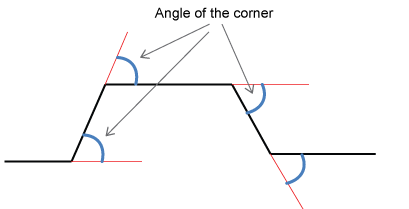
Corner Sharpness Angle Range
The operator detects angles with an absolute value between a minimum (MinCornerAngle) and maximum (MaxCornerAngle) sharpness range:
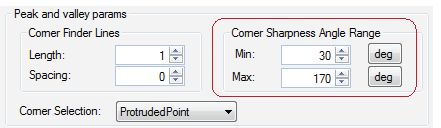
Modify the range to limit the range of angles you want the operator to identify as corners.
Be aware they cannot be set to the same value, and the Min cannot be set to 0 and the Max cannot exceed 180.
Corner Selection
The operator supports different options for selecting the location on or relative to the profile where a corner can be identified:
The following graphic represents the different options for the corner selection (CornerSelection):
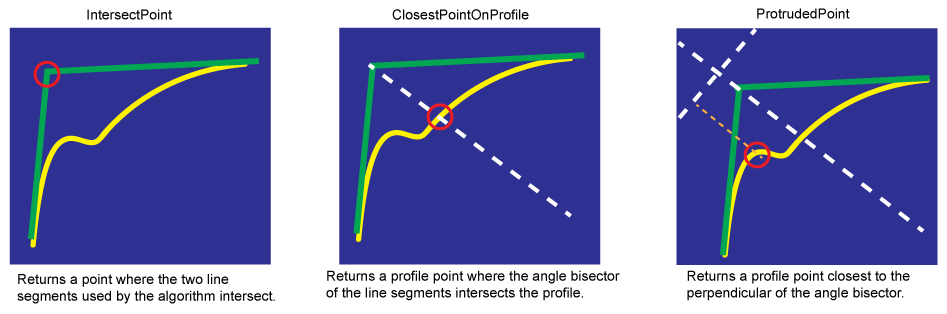
By default, the operator uses the ProtrudedPoint option, equivalent to the Cognex In-Sight Explorer profile corner finder. Choose a different option as your application requires.
Sort Multiple Results
Depending on the parameter settings you choose, an ExtractCorner operator can find multiple corners. Use the sorting parameters to determine how the tool sorts the results and ultimately choose which corner is made available to other operators you add to this 3D Range Image Cross Section tool:
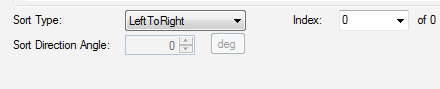
The Sort Type (SortType) supports the following options:
| Sort Type | Description |
| LeftToRight | The sorting order is based on the x-axis position of the corner, with the corners sorted from left to right. |
| RightToLeft | The sorting order is based on the x-axis position of the corner, with the corners sorted from right to left. |
| Sharpness | The sorting order is based on sharpness of the corner, with the corners sorted from sharpest to least sharp. |
AlongAngleDirection | The sort order is based on the value of Sort Direction Angle: 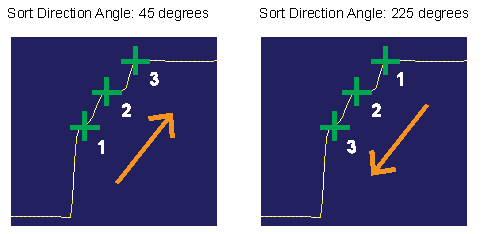 |
Use the Index field to specify which corner to return from the operator when multiple corners are identified.
Result Tolerances
Use the Tolerance tab to specify 2D position tolerances for any result the operator might return:
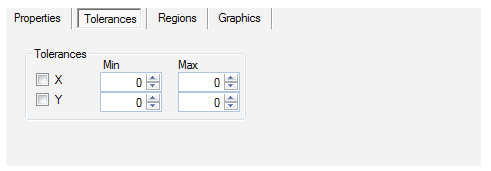
Set a Min and Max value on both the x-axis (XTolerance) and y-axis (YTolerance) to limit the area where valid corners can be found.
Input Region
Use the Regions tab to add multiple regions of interest to this ExtractCorner operator and to define the characteristics of each region:
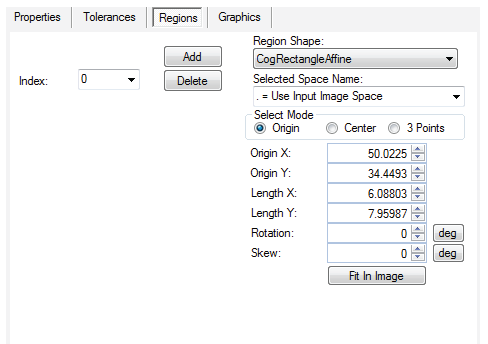
The tab allows you to add or remove additional regions for use by this single ExtractCorner operator. The operator returns the corner from a single region based on the parameters you specify for corner type and sorting results. The operator disregards the portions of the profile outside the defined regions.
Click on any region graphic to position and shape it manually, or use the parameters in the Region tab to provide exact values.
Graphics
Use the Graphics tab to control which graphics appear over the Current.Profile:
| Option | Graphic |
Show Sharpness Graph | Show a graph representing the sharpness of the corners across the profile: 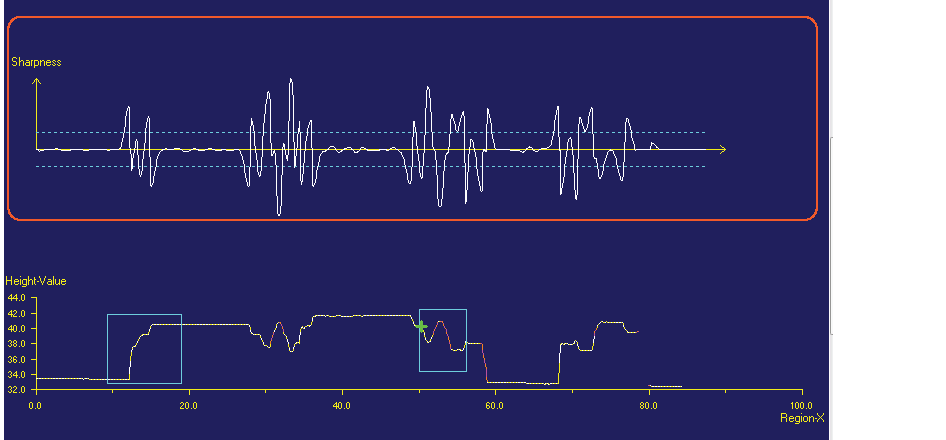 By default, the graph displays a dotted blue line representing the Min setting for the corner angle sharpness range. Enable the Show Max Corner Angle Line option to enable a similar graphic representing the corresponding Max setting. |
Show result line fit regions and Show result line fit lines | Show graphics representing the line segments used for Peak and Valley corner finding and the regions surrounding them. You must zoom in on the Current.Profile to see the graphics: 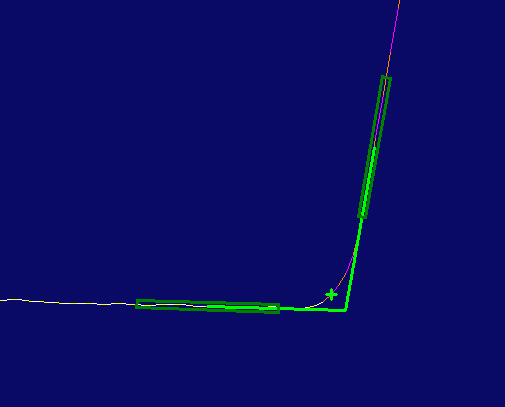 The region graphics for fitting lines represent the line length. The line segments themselves are from the middle of the region to the intersect point |
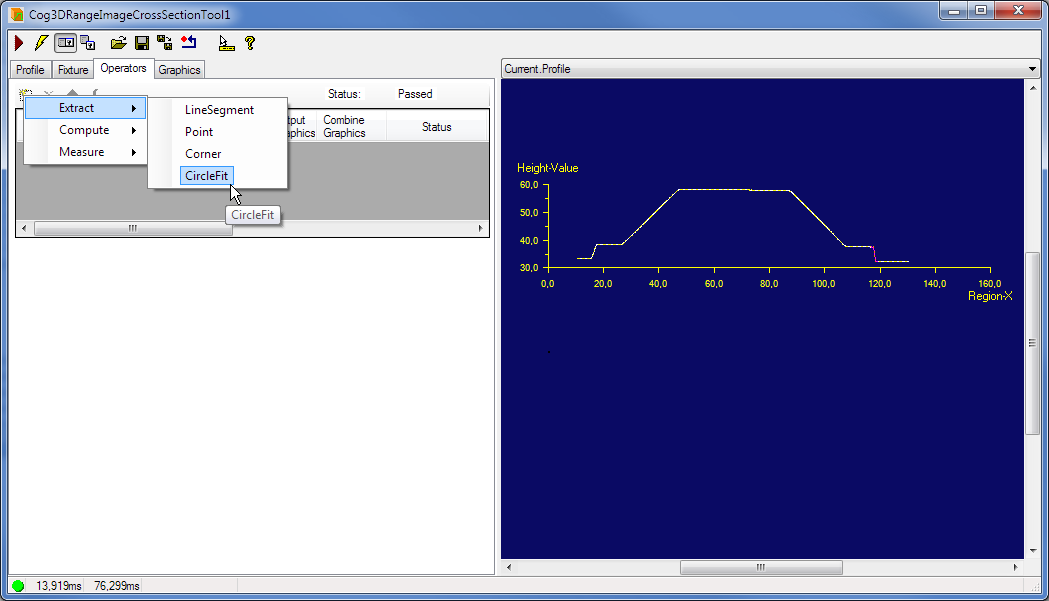
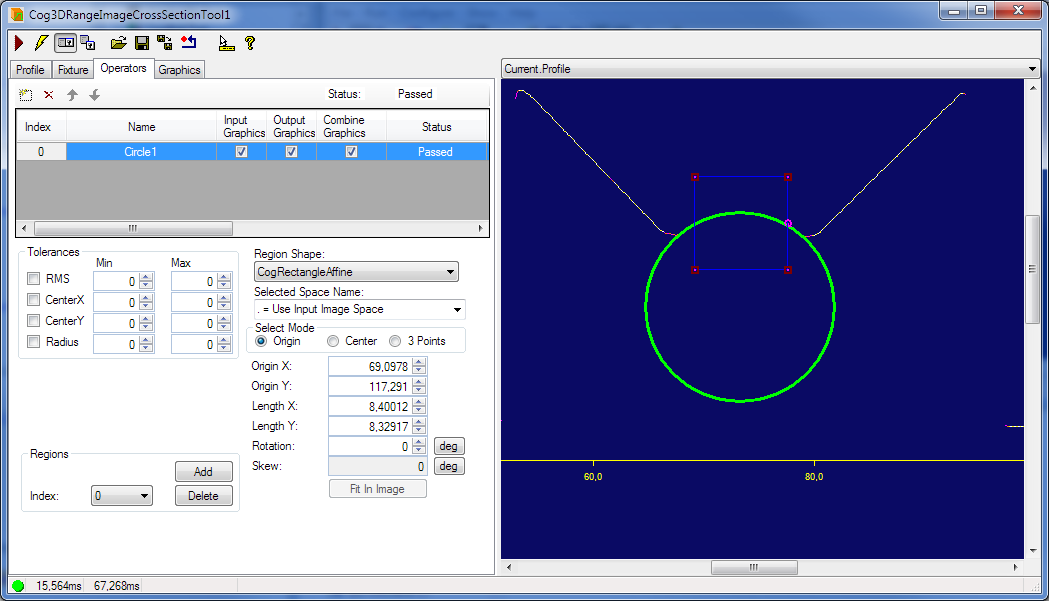
The Cog3DRangeImageCrossSectionExtractCircleFit operator is used to fit a circle to a user-selected region of the cross-section profile's curve. Please note that this operator is a fitter and not a finder, i.e. it will fit a circle the best way it can using all the chosen points of the input profile even if those points do not represent a circular feature of the object. This operator does not try to find which input points belong to a circle. It assumes that the correct points have already been found within the selected region.
The CircleFit operator’s user interface lets the user:
- Specify regions of interest along the input profile
Set tolerance for the following properties of the found circle
- CenterXTolerance
- CenterYTolerance
- RadiusTolerance
This is the root mean square error (in units of the selected space) between the selected points of the input profile and the fit circle.
It is important to select only points on the input profile that truly represent circular features. Including improper points can result in a poor circle fit.
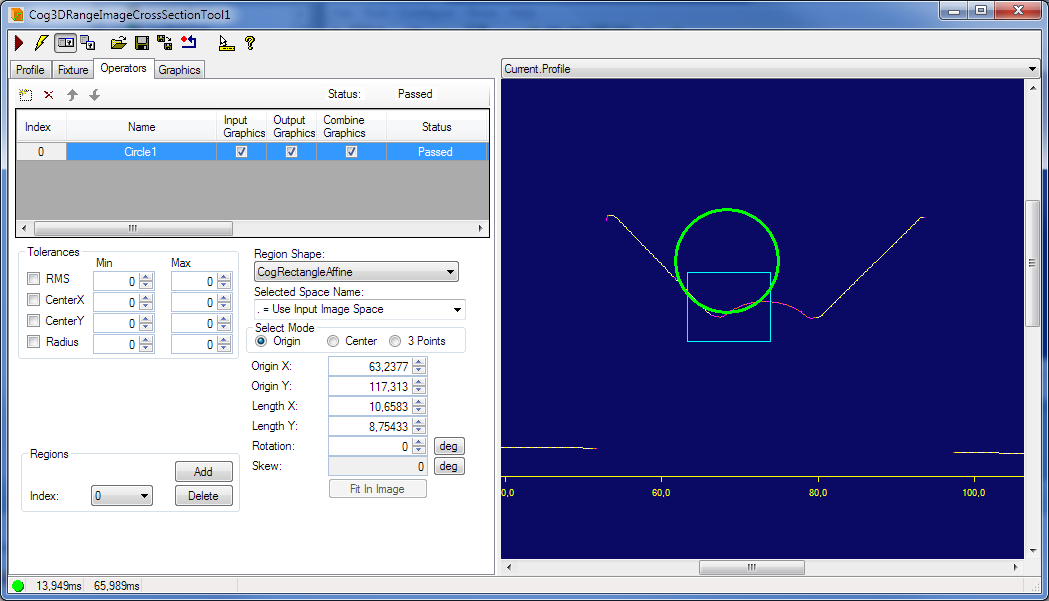
NOTE: this is a fitter and not a finder tool. It will be able to fit a circle on any profile (that contains enough points to do so), see below:
The IntersectLineLine operator computes the intersection point of two lines, each defined by a line segment produced by another operator.
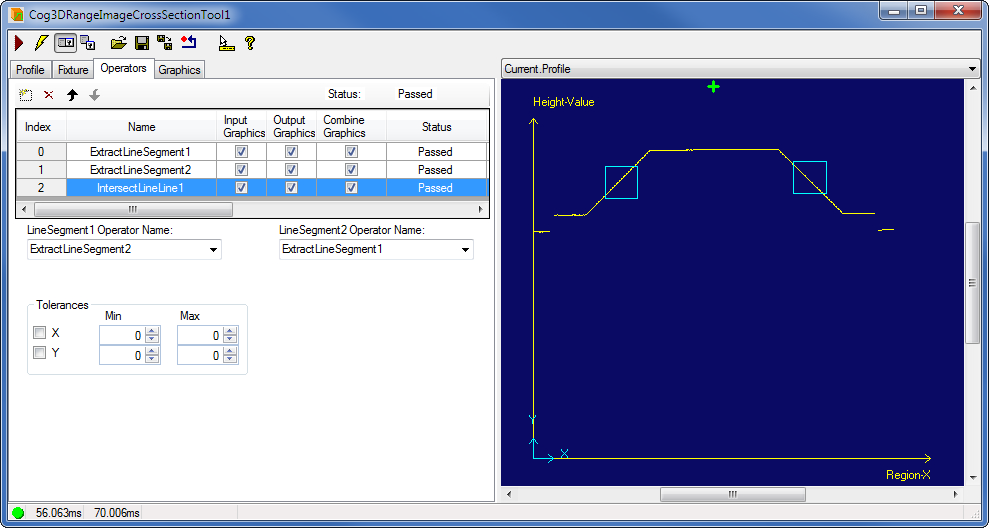
- X coordinate of the intersection point
- Y coordinate of the intersection point
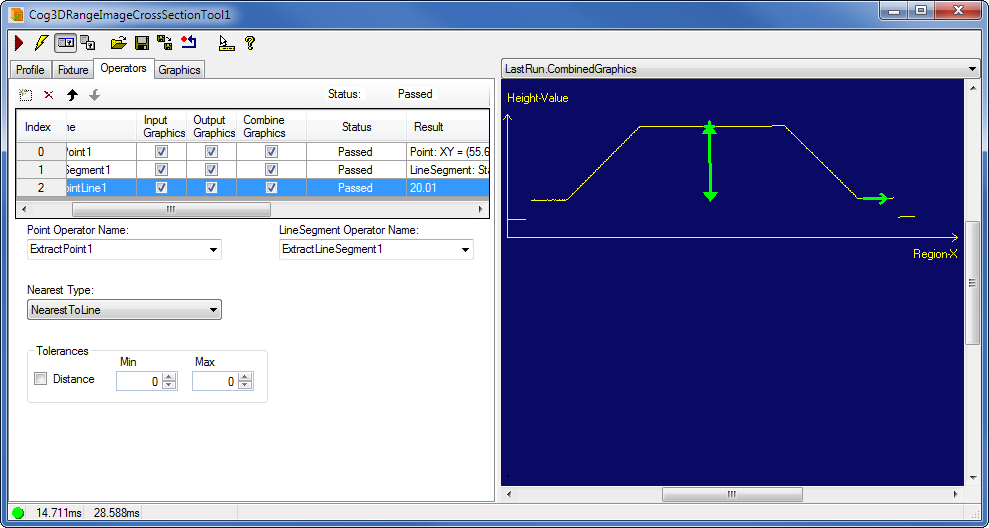
The PointLineSegment operator computes a point on a line segment.
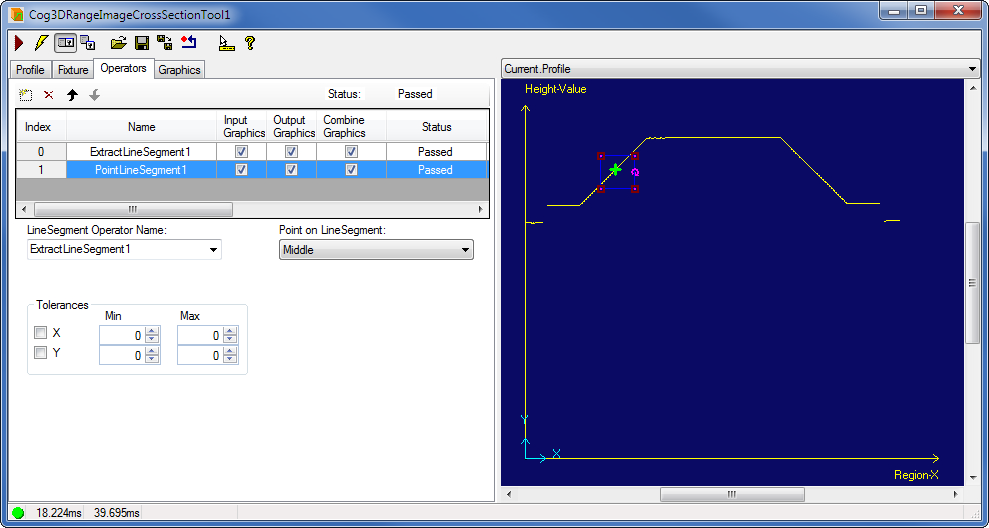
- X coordinate of the point
- Y coordinate of the point
The MidpointPointPoint operator computes the middle point between two points. The following figure shows the computed middle point and the regions based on which the two input points were extracted. You can view all the points in the LastRun.CombinedGraphics record.
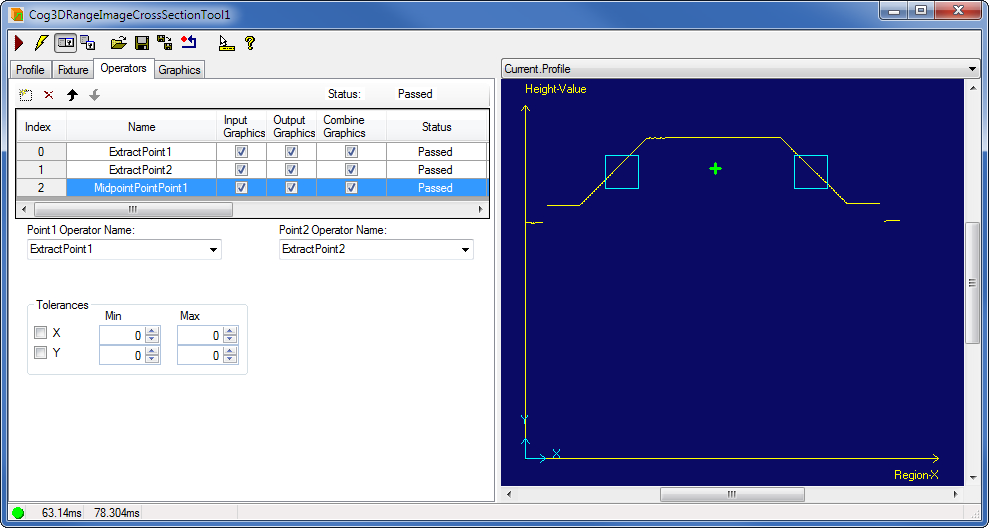
- X coordinate of the point
- Y coordinate of the point
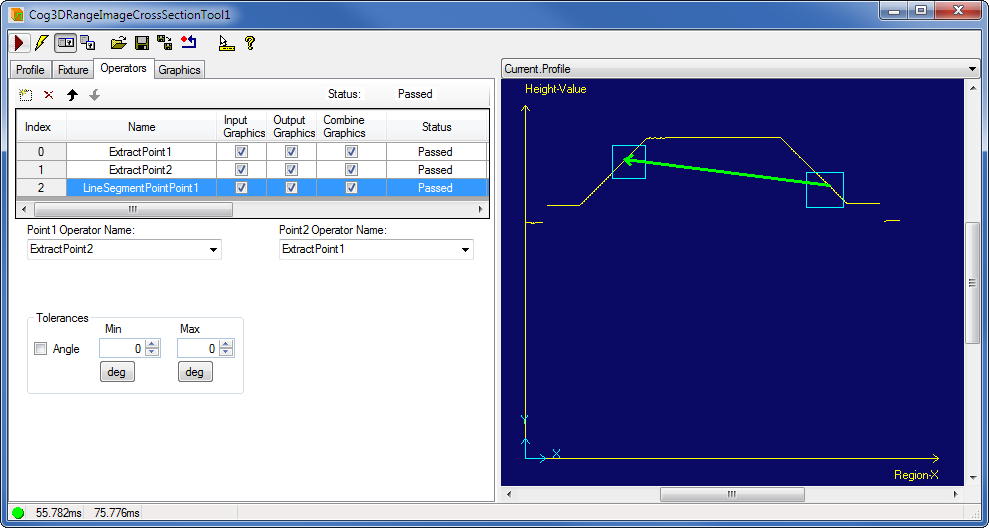
The LineSegmentPointPoint operator computes the line segment between two points. The following figure shows the computed line segment and the regions based on which the two input points were extracted. You can view both points and the line segment in the LastRun.CombinedGraphics record.
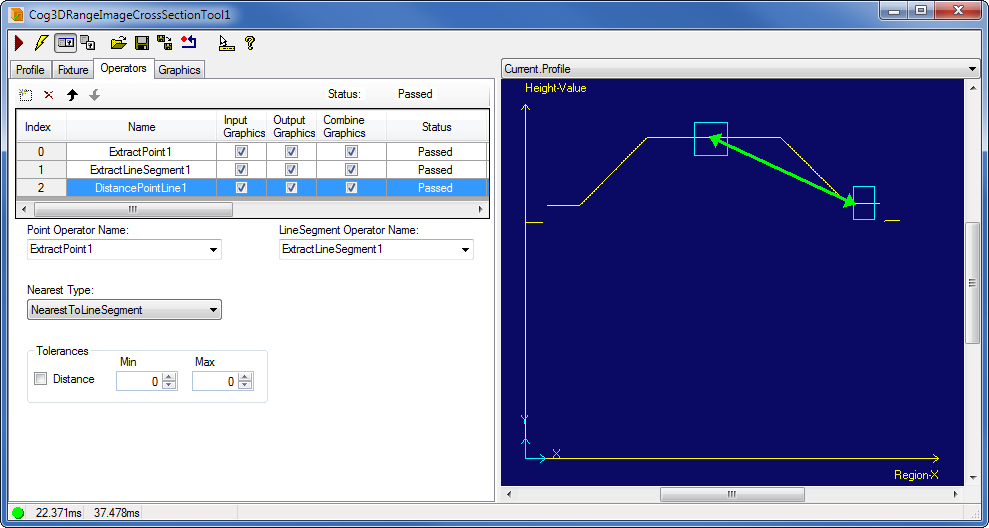
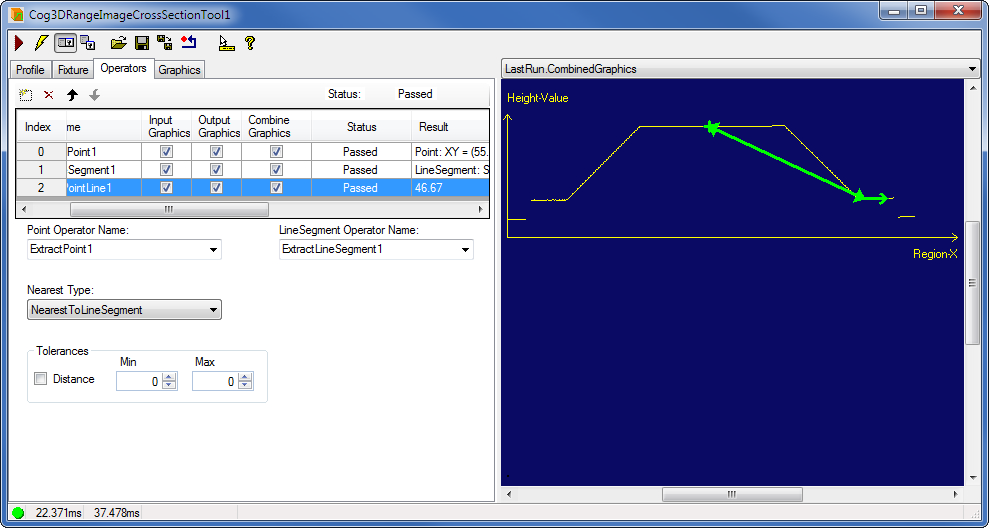
The NearestPoint operator computes the nearest point from a point either on a line or on a line segment. (The line segment is a portion of the line.)
The following figures show computing the nearest point on a line.

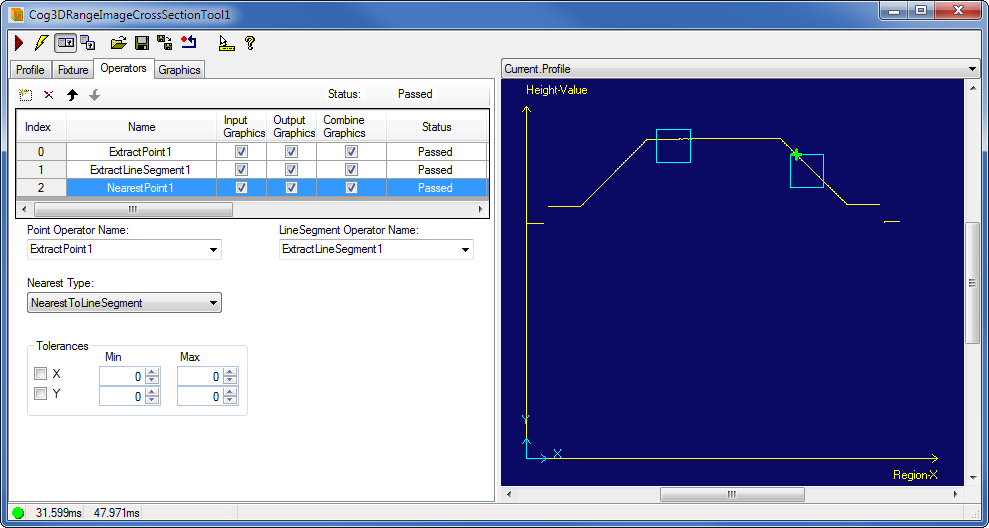

- X coordinate of the point
- Y coordinate of the point
The Cog3DRangeImageCrossSectionPointAreaResult operator can have an input of the result of an area measurement and extract one single point of interest from the result object (only if the points are valid).
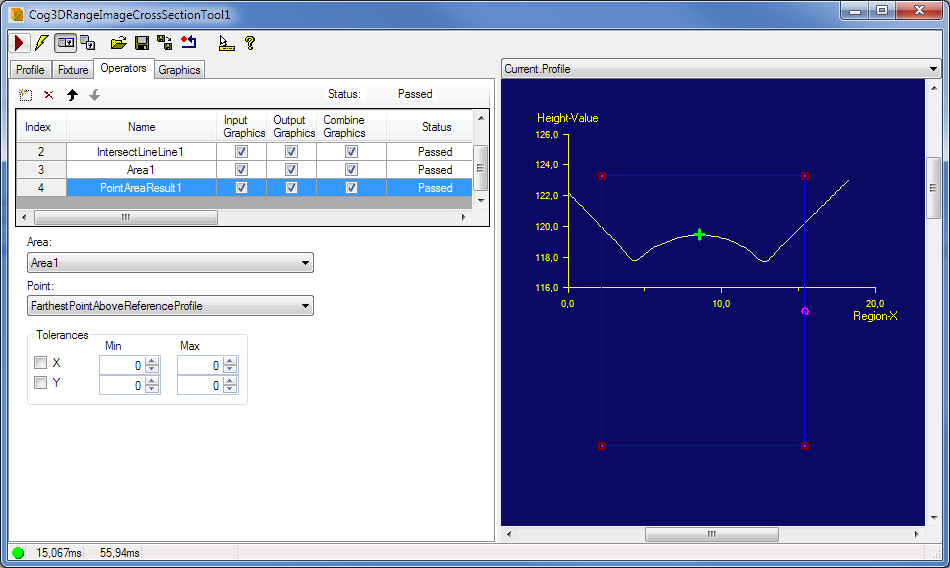
The following properties are available:
- Area
Point: The AreaResult’s extract point operator provides functionality and user interface to extract one of the six points of interest of the complex area result. The PointAreaResult operator is there to get one of these points (if exist) out of the result object:
Tolerances
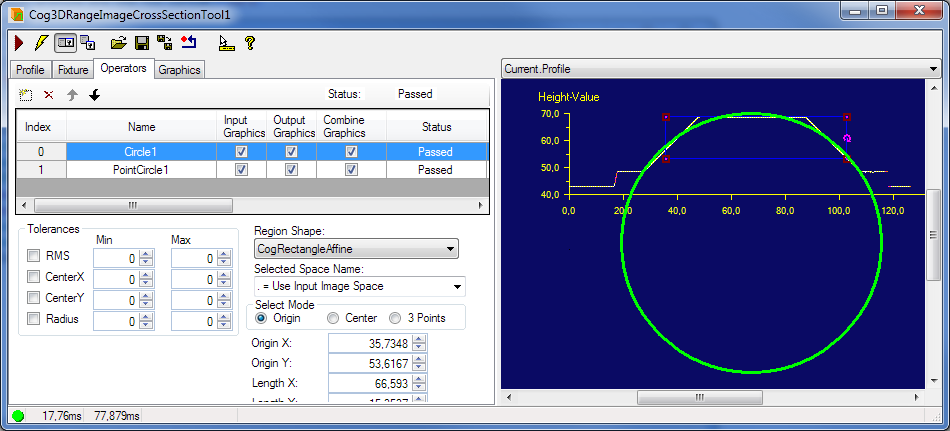
The Cog3DRangeImageCrossSectionPointCircle operator allows customers to use the circle center point in downstream calculations. For example, the user can measure the Euclidean distance between two circle centers or between a circle center and a line segment.
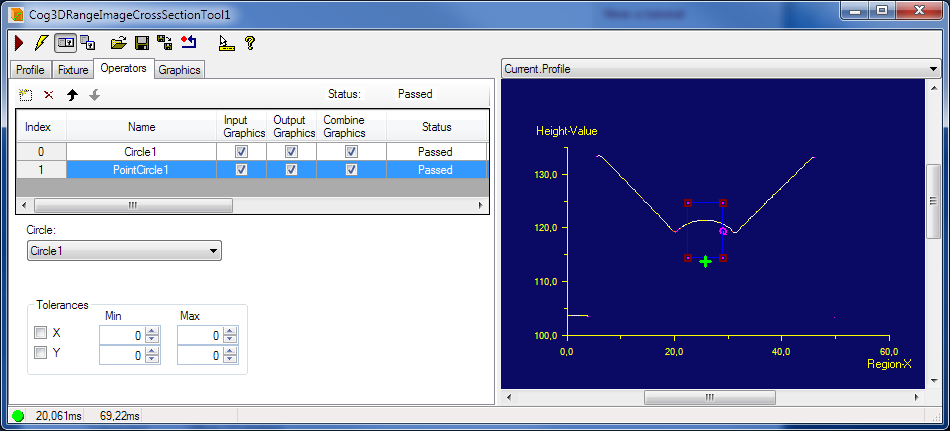
The PointCircle operator can be found under the menu item Compute. It lets the user:
- Specify the operator that produces the circle.
Set tolerance for the following properties of the found circle:
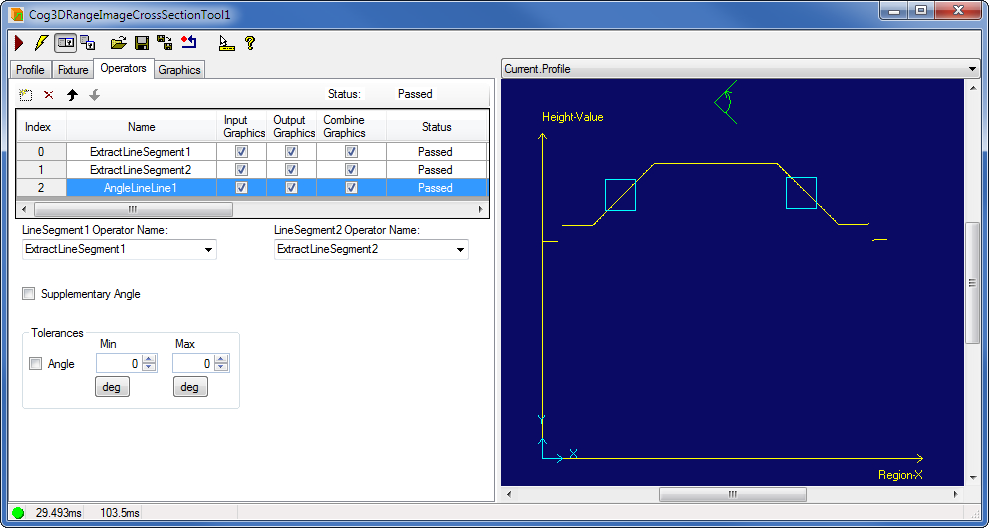
The AngleLineLine operator measures the angle between two line segments. The following figures show the measurement of the angle between two line segments.
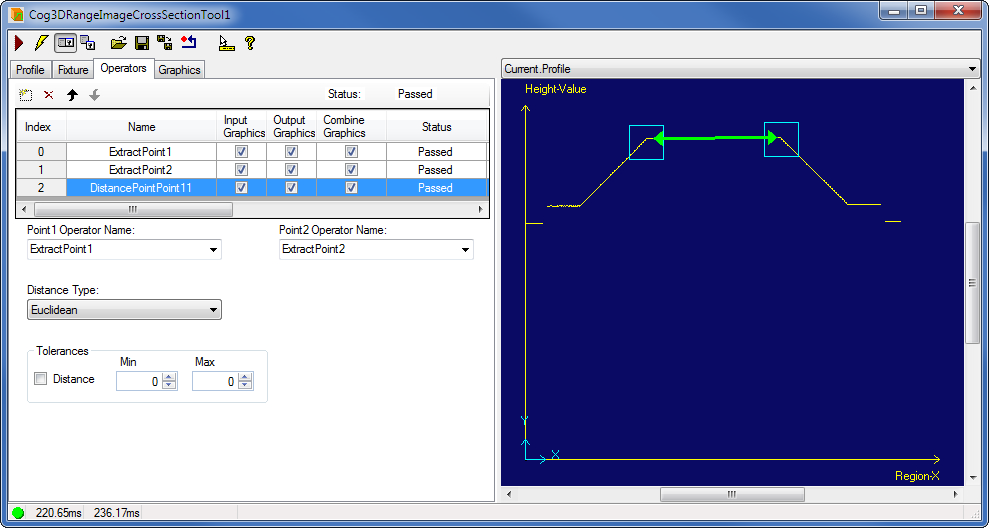
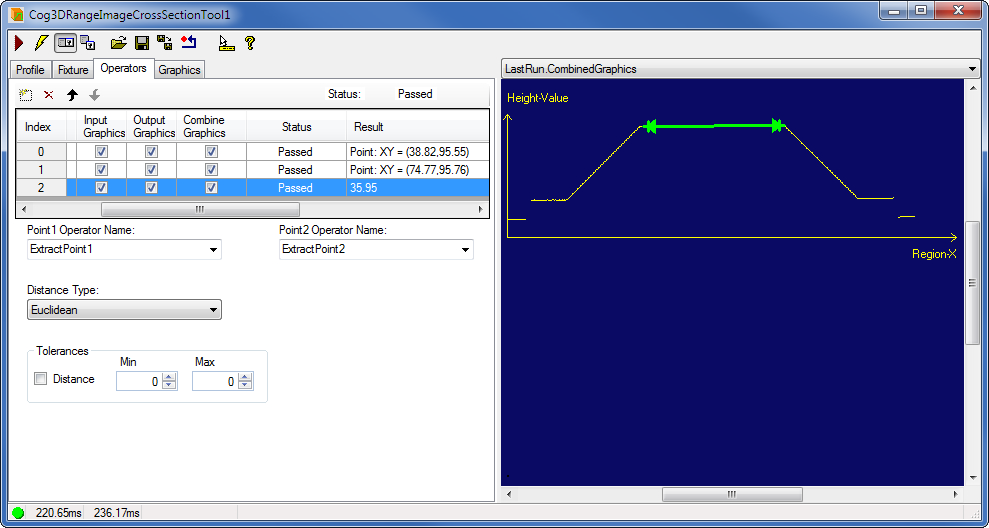
The DistancePointPoint operator measures the distance between two points. The following figures show the measurement of the distance between two points.
The DistancePointLine operator measures the distance between a point and a line or a line segment. (The line segment is a portion of the line.)
The following figures show measuring the distance to the nearest point on the line.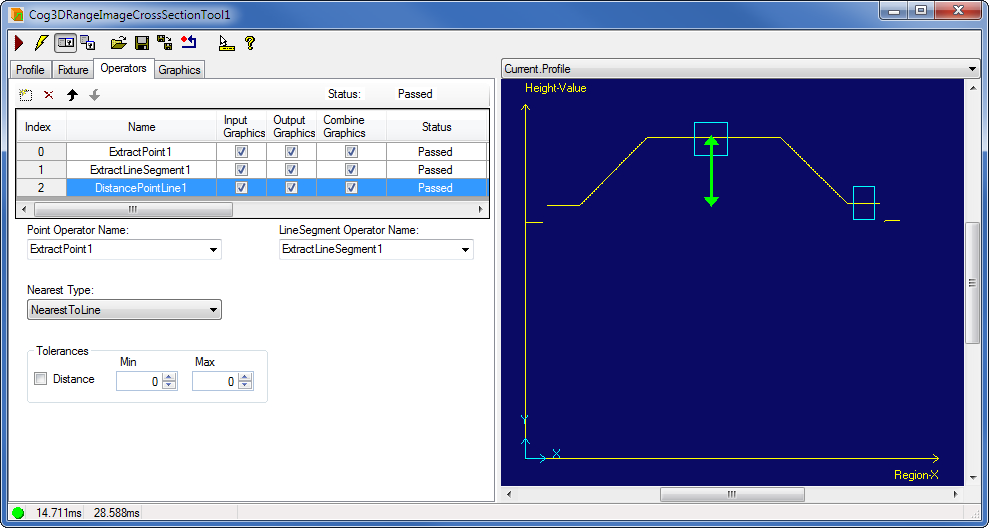
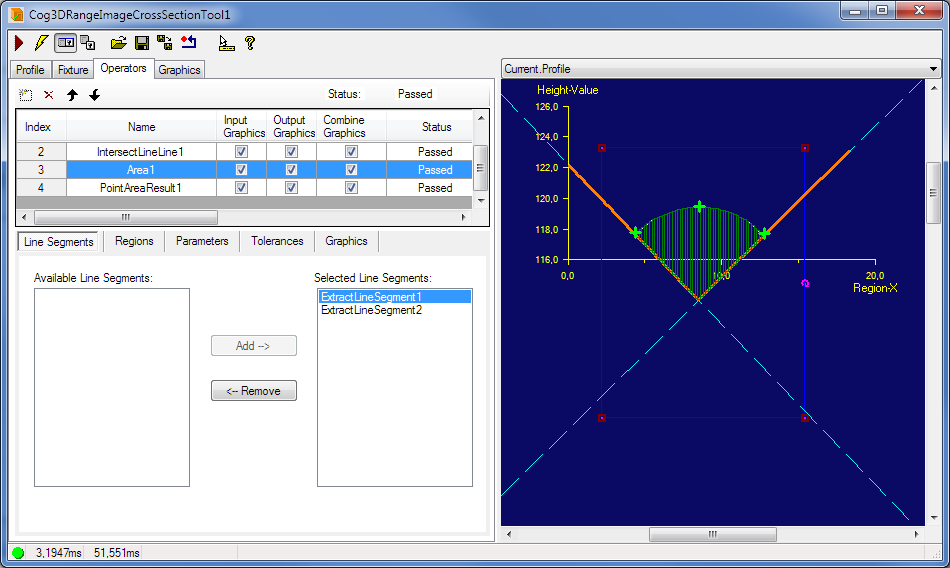
This section describes the edit controls that are available for the Area operator (Cog3DRangeImageCrossSectionAreaLineSegments). The area measurement operator produces the result to get the point from. For more detailed information on using the operator, see the Using the Cross Section Tool section. In general, the new operator will measure the area between:
- The profile of a cross-section and
- one or more line segments.

The Area operator has five tabs with the collected parameters:
Line Segments Tab
Allows the user to select the input line segments (more precisely the operators that produce those line segments) for the Area operator (AddLineSegment). This group is very operator specific and it provides the UI for setting the input of the operator.
The following tabs are not specific to the Area Under Line Segments operator and they will be the same for all of the area measurement operators.
Regions Tab
Allows the user to configure the regions of interest, add and remove regions.
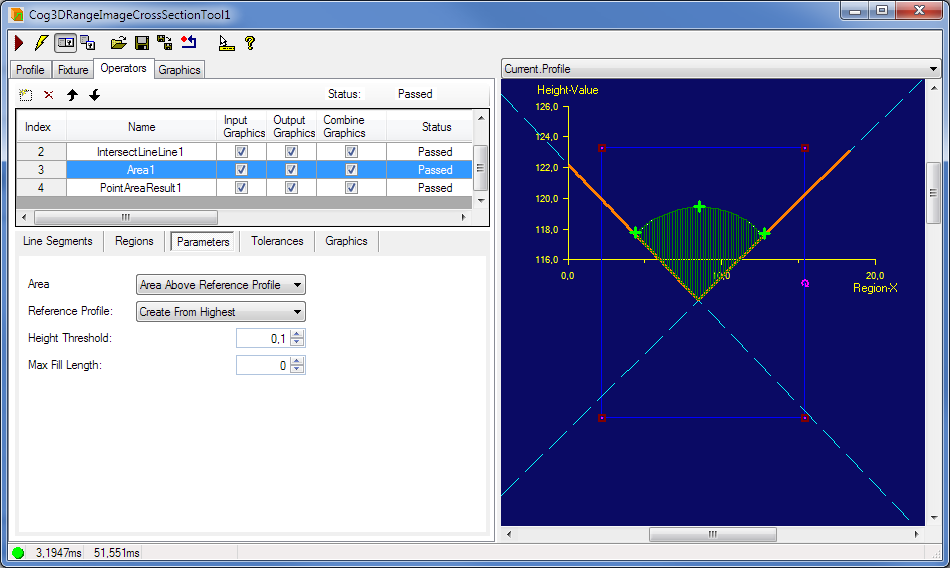
Parameters Tab
Allows the user to set the generic area measurement parameters:
- Area: Gets or sets what area is being measured - above or below the reference profile or both of those and if both, how they are combined (Area).
- ReferenceProfile
- HeightThreshold
- MaxFillLength
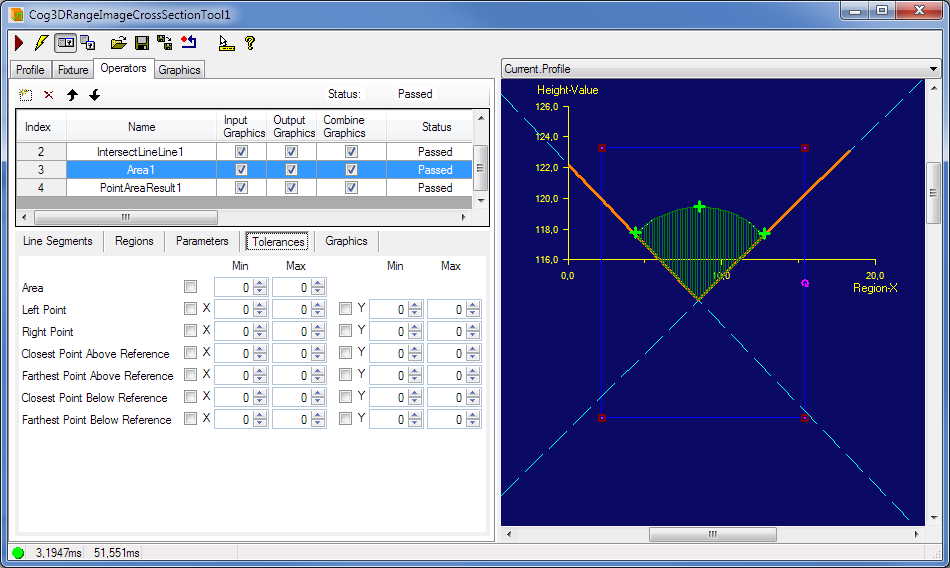
Tolerances Tab
Allows the user to enable or disable the specific tolerances and set Minimum and Maximum value for each tolerance. The following values can have tolerance settings:
- Area
- LeftPointXTolerance
- LeftPointYTolerance
- RightPointXTolerance
- RightPointYTolerance
- ClosestPointAboveReferenceProfileXTolerance
- ClosestPointAboveReferenceProfileYTolerance
- FarthestPointAboveReferenceProfileXTolerance
- FarthestPointAboveReferenceProfileYTolerance
- ClosestPointBelowReferenceProfileXTolerance
- ClosestPointBelowReferenceProfileYTolerance
- FarthestPointBelowReferenceProfileXTolerance
- FarthestPointBelowReferenceProfileYTolerance
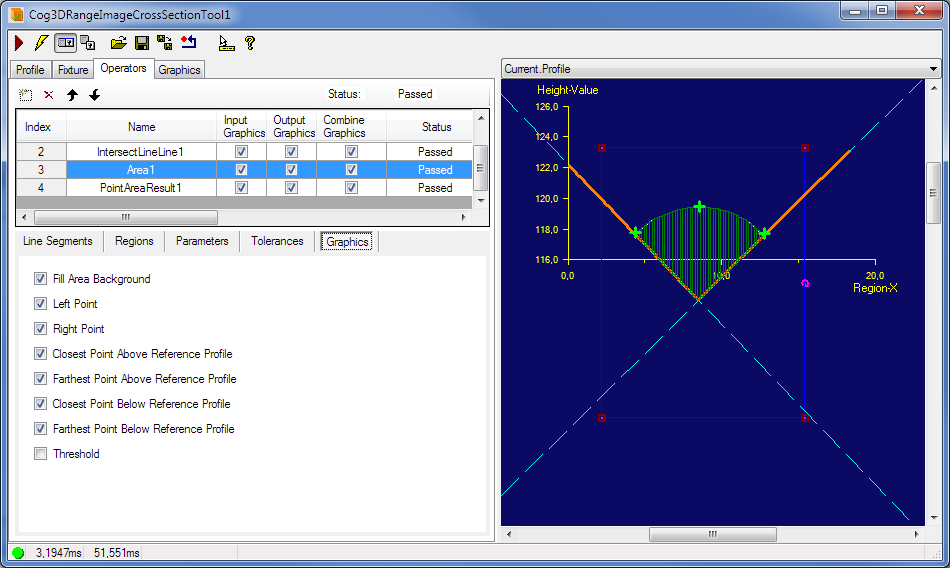
Graphics Tab
Allows the user to turn on/off specific output graphics.
- Fill Area Background
- Left Point
- Right Point
- Closest Point Above Reference Profile
- Farthest Point Above Reference Profile
- Closest Point Below Reference Profile
- Farthest Point Below Reference Profile
- Threshold
The created graphics of the area measurement operators are the following:
- Drawing the inputs (if available) (cyan)
- Drawing the reference profile created from the input shapes (orange)
- Drawing the regions (interactive controls) (blue/cyan rectangles)
- Drawing the outline of the measured area(s) (dark green / dark red depending whether the area passes tolerance or not)
- Fill the measured area’s background (dark green / dark red depending whether the area passes tolerance or not)
Drawing PointMarkers for the following interesting points (green / red depending whether the point passes tolerance or not)
- LeftPoint
- RightPoint
- ClosestPointAboveReferenceProfile
- FarthestPointAboveReferenceProfile
- ClosestPointBelowReferenceProfile
- FarthestPointBelowReferenceProfile
- Drawing the threshold markers above and below the reference profile (white)
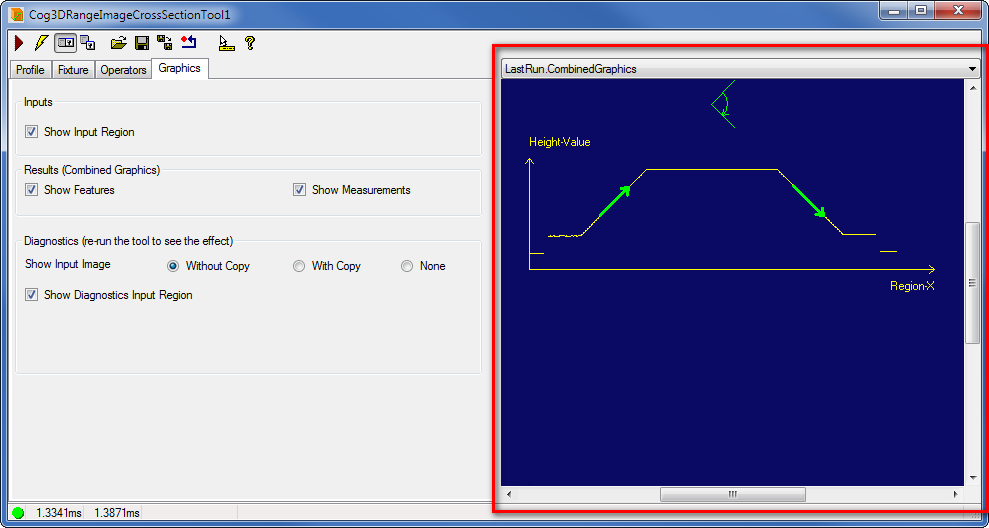
Use the Graphics tab to control which graphics the Range Image Cross Section tool generates and displays. The following figure shows the default Graphics tab:
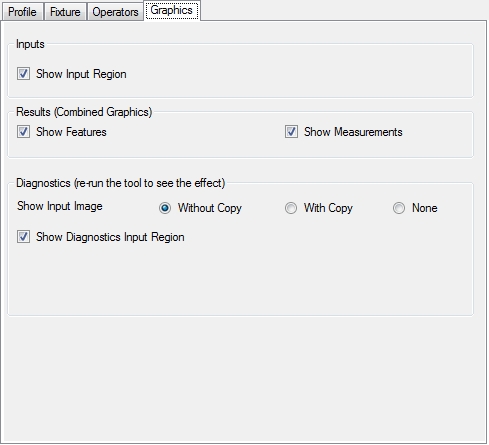
| Feature | Description |
| Show Input Region | Displays the Region based on which profile creation is performed in the Current.InputImage record. |
| Show Features | Displays the extracted or computed features in the LastRun.CombinedGraphics record. The Combined Graphics option must be enabled on the operator for the graphic to be shown in the LastRun.CombinedGraphics record. |
| Show Measurements | Displays the measurements in the LastRun.CombinedGraphics record. The Combined Graphics option must be enabled on the operator for the graphic to be shown in the LastRun.CombinedGraphics record. |
| Show Input Image | The Without Copy, With Copy, and None options determine whether or not the input image and the combined graphics are recorded as part of the diagnostic (LastRun) record; and whether the input image and the combined graphics are copied to the record or saved in the record as a reference. |
| Show Diagnostics Input Region | Displays the diagnostic input Region based on which profile creation is performed in the LastRun.InputImage record. You must re-run the tool for this setting to take effect. |