Red Analyze Tool – Statistics
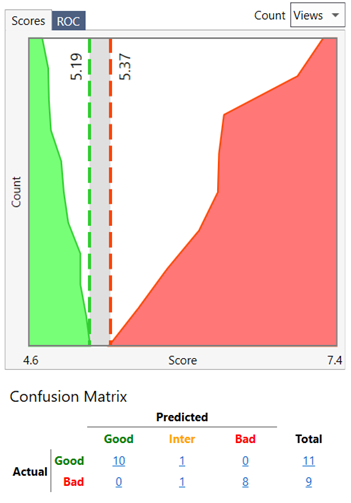
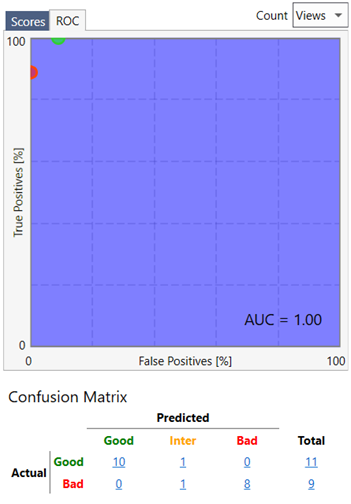
Once trained, results will be displayed in graphs and confusion matrix forms.
|
|
|
Note:
- The processing time per image is also listed above the graph.
- When the Red Analyze tool is in Supervised mode, there are additional Region Area Metrics included below the Confusion Matrix. The Region Area Metrics return data about the Recall, Precision and F-Score of the currently trained tool. Recall refers to how likely the tool is to find a defect in a given image; Precision is how likely the tool is to find a defect where there is an actual defect; and F-Score is average of Recall and Precision.