ImageMath
A multipurpose function, ImageMath produces a greyscale or black-and-white output image where every pixel is the result of an arithmetic operation, such as addition, subtraction, or averaging, performed between two input images.
ImageMath Inputs
| Parameter | Description | ||||||||||||||||||||||||||||||||||||||||||
|
Image 1 |
|||||||||||||||||||||||||||||||||||||||||||
|
Image 2 |
|||||||||||||||||||||||||||||||||||||||||||
|
Operation |
Specifies the image-processing operation that produces a greyscale or black-and-white output image.
|
||||||||||||||||||||||||||||||||||||||||||
|
Display X |
Specifies the x-coordinate (default = 0) where the output image will be displayed, relative to the upper left-hand corner. |
||||||||||||||||||||||||||||||||||||||||||
|
Display Y |
Specifies the y-coordinate (default = 0) where the output image will be displayed, relative to the upper left-hand corner. |
||||||||||||||||||||||||||||||||||||||||||
|
Show |
Specifies which graphical overlays are displayed on top of the image.
|

ImageMath Outputs
|
Returns |
An Image data structure containing the processed image, or #ERR if any of the input parameters are invalid. |
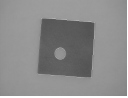
ImageMath Example
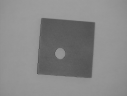
In this example, the goal is to produce an output file of only the holes in a gasket. Later, the holes are referenced by another tool so that decisions can be made regarding the holes.
-
Acquire an image of the complete gasket.
-
Create an Image 2 to be a copy of Image 1, but with all the white holes filled. To produce this, insert the Filter function into the spreadsheet.
-
Maximize the ROI in the property sheet by selecting the word Region and clicking the Maximize Region
 button in the toolbar of the property sheet. Maximizing the ROI ensures that the ROIs of Image 1 and Images 2 are the same size.
 -
Select Fill Light Holes from the Operation dropdown menu.
-
Accept the default settings of the other parameters and click OK in the Filter property sheet to complete the configuration and apply the function to the input image.
-
Insert the ImageMath function into the spreadsheet.
-
Accept A0 as Image 1 in the property sheet. Now, the Filter output image must be referenced as the source for Image 2.
-
Double-click on Image 2 in the property sheet, which disappears to reveal the In-Sight Spreadsheet spreadsheet.
-
Click the Image data structure returned by Filter.
-
Click the OK button on the Job Edit toolbar to confirm the selection and return to the ImageMath property sheet. (The selection can also be confirmed by pressing the Enter key or by double-clicking on the Image data structure.)
-
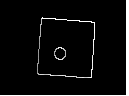
Select Differences from the Operation dropdown menu.
-
Accept the default settings of the other parameters and click OK in the property sheet to complete the configuration for this example and apply the function to the input image. The result is an output image of only the holes in the gasket.