Segment 3D
You can use the Segment 3D tool for finding flaws or locating features on a 2D projection of a 3D image. After training, the tool can predict the appearance of the features in the new images.
To add the Segment 3D tool:
-
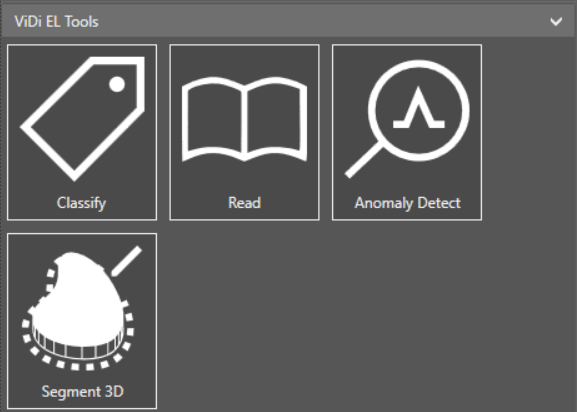
Select the Segment 3D tool under the ViDi EL Tools group in the Inspect application step.
-
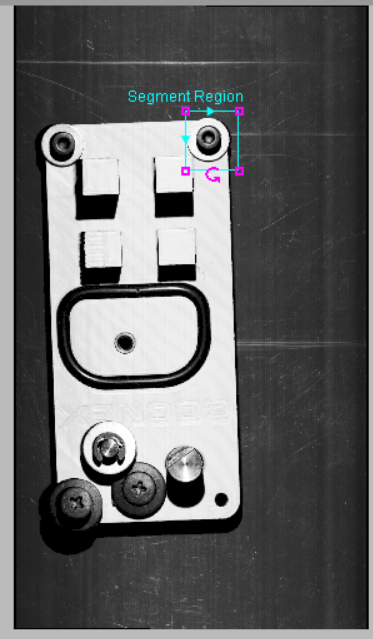
Position the region over the area you want to segment. To resize the Segment Region box, click and drag the corners. To rotate the box, click and drag the rotate button.
-
Click OK.
Note: Once you click OK, you can no longer resize the region of interest (ROI). -
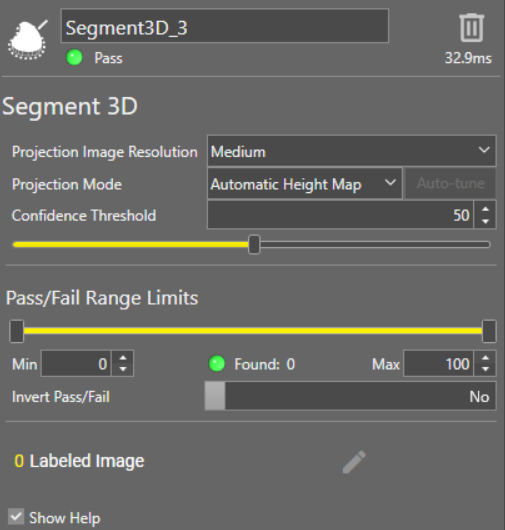
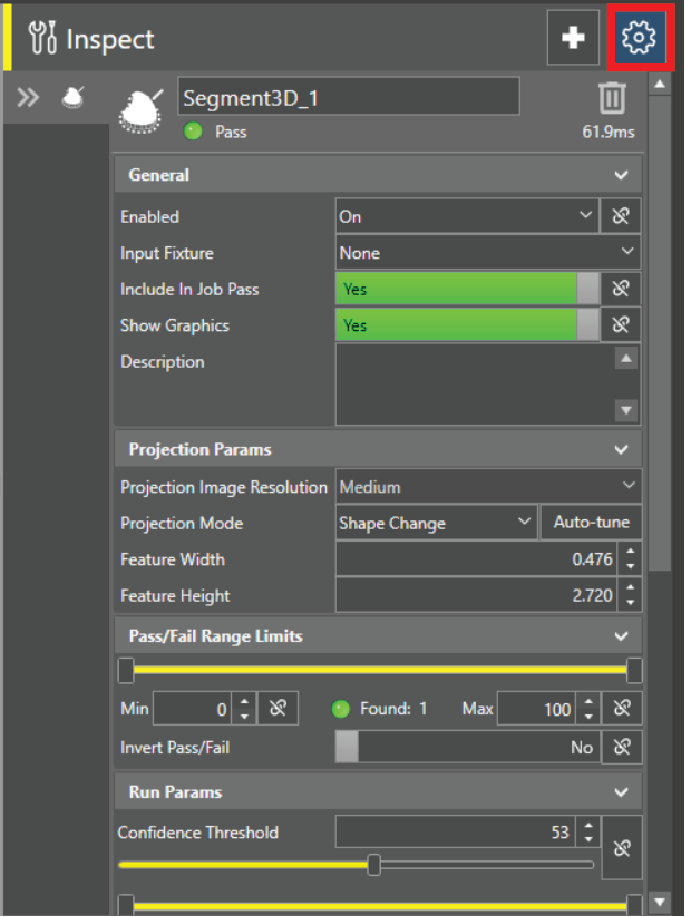
The Segment 3D tool appears in the list of configured tools, and the Segment 3D tool property edit panel opens.
-
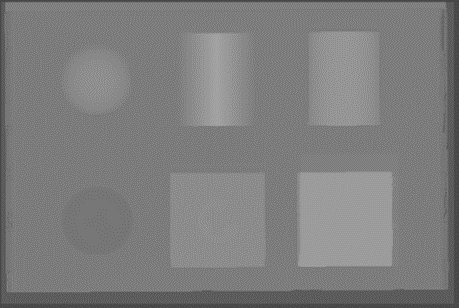
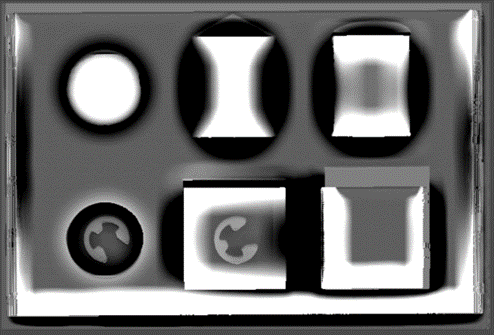
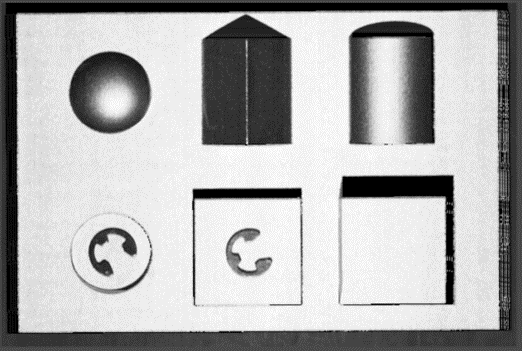
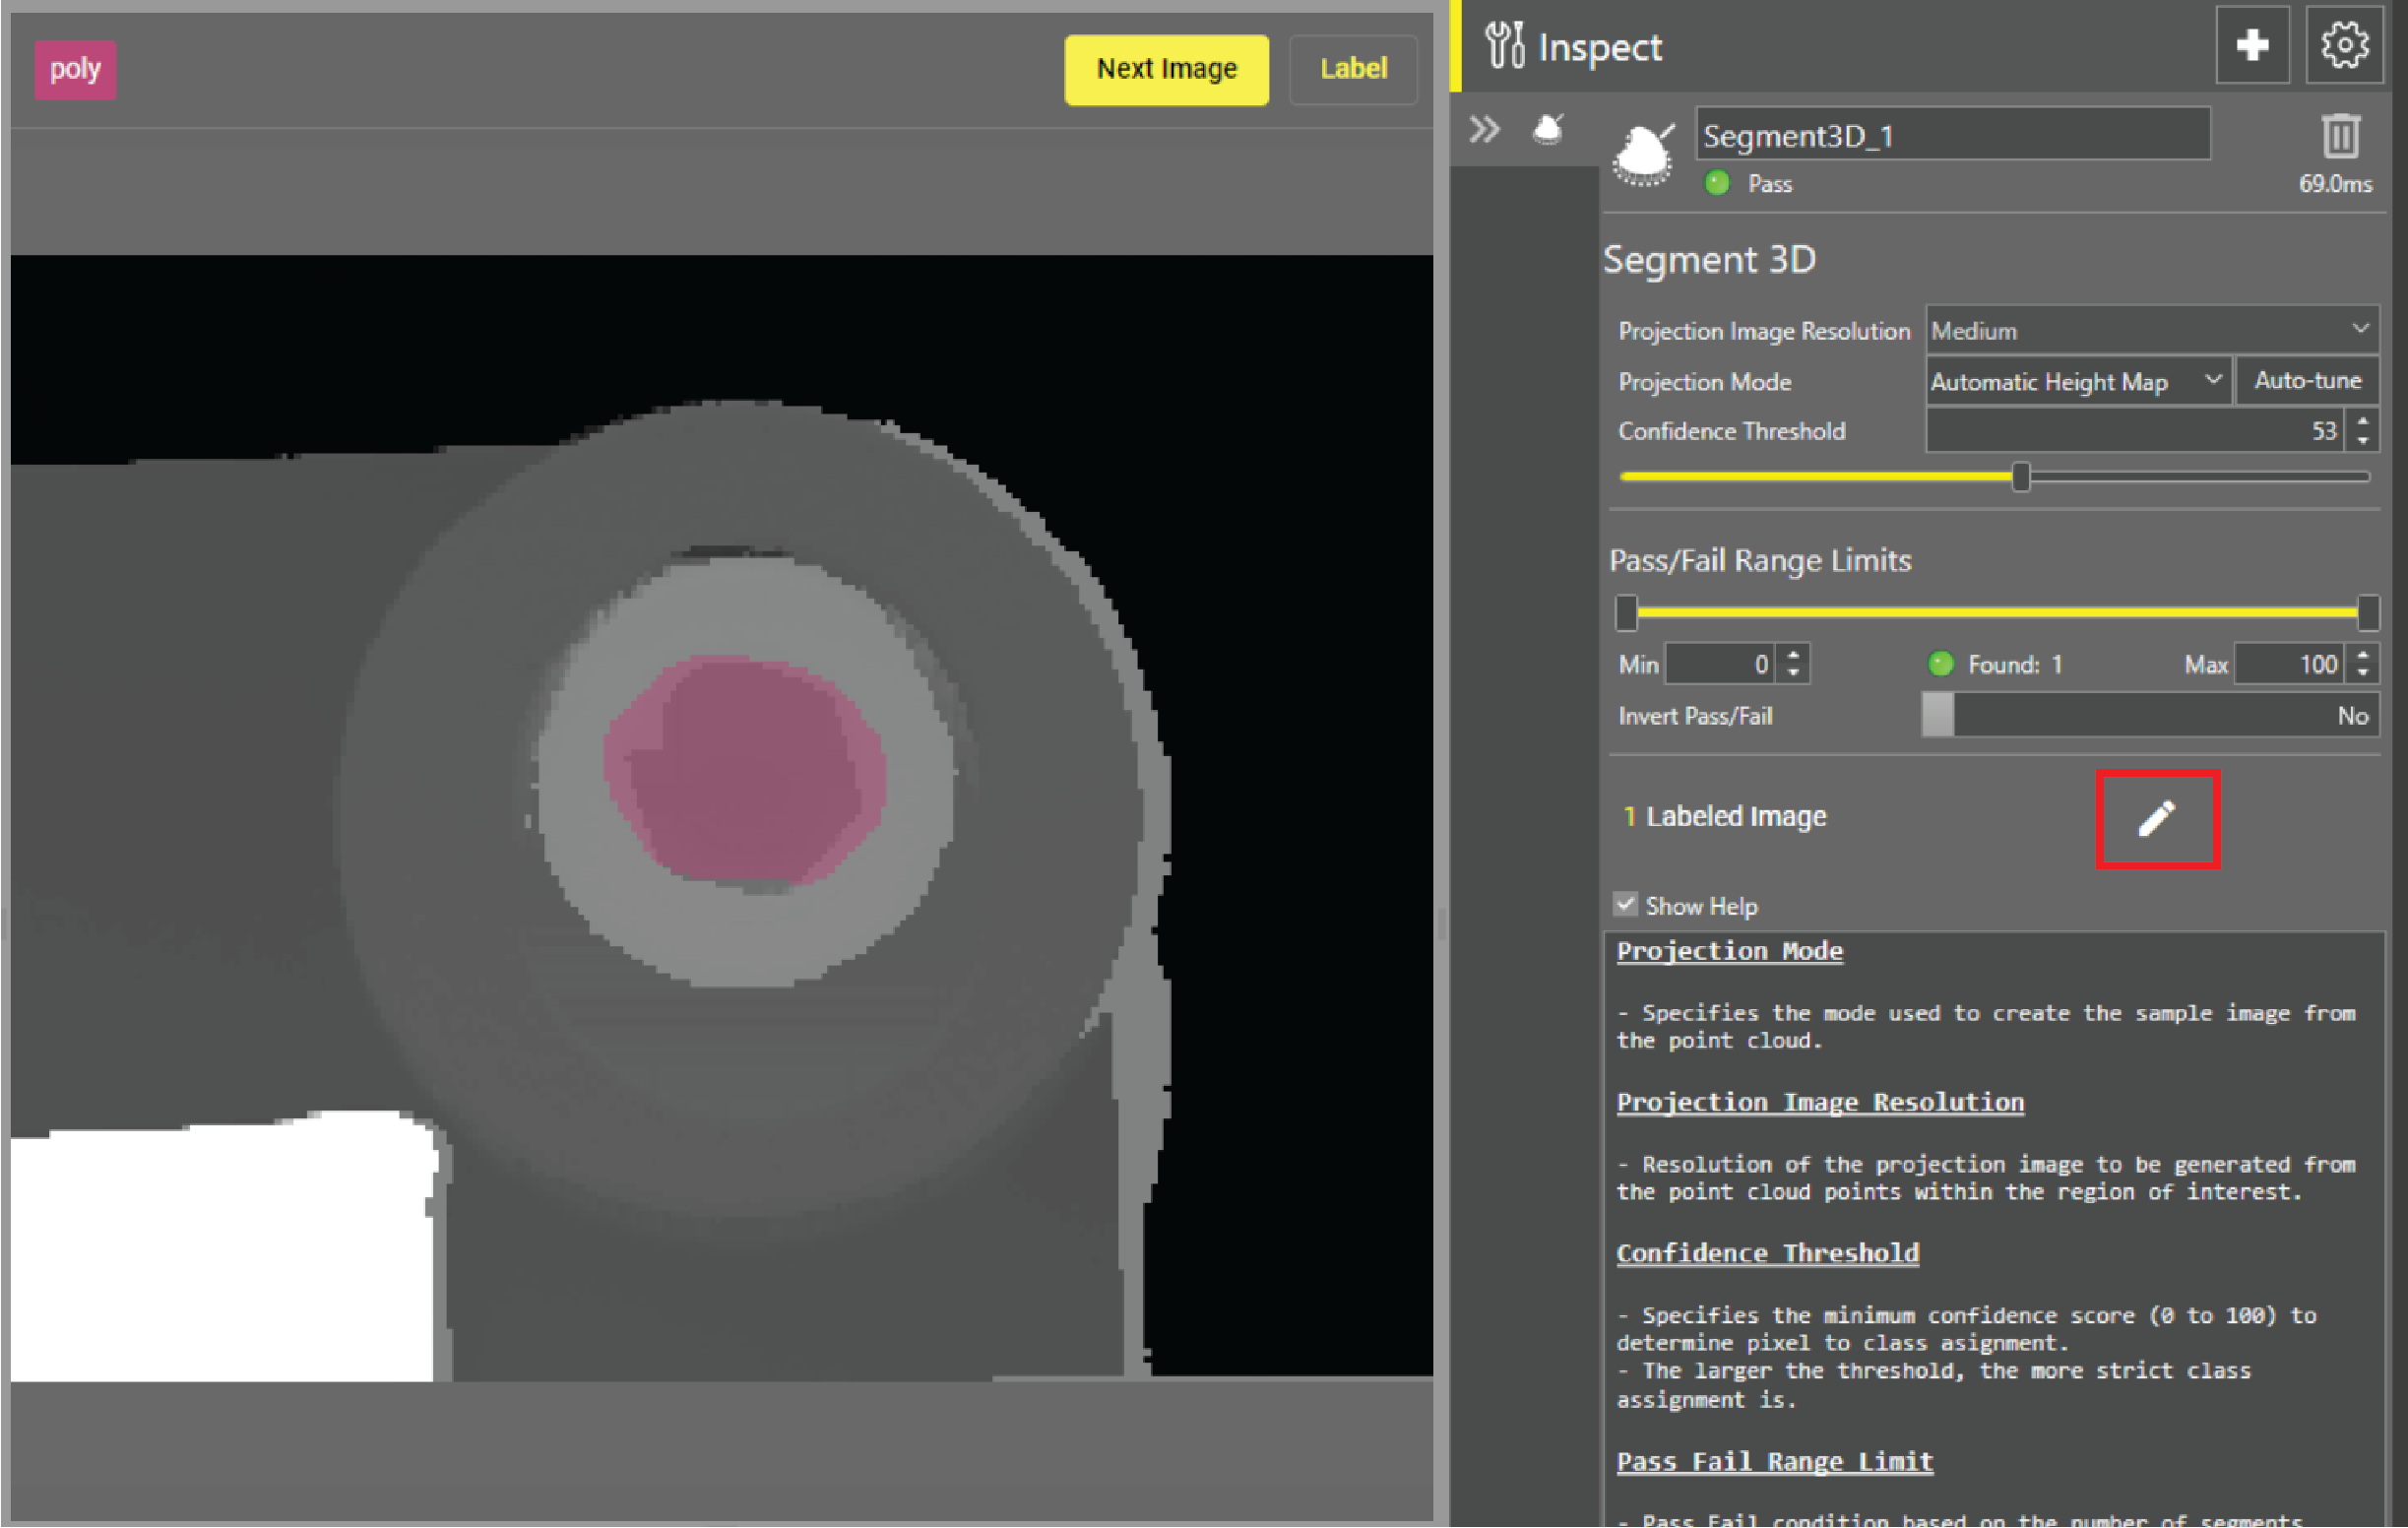
Select the Projection Image A projection image is the 2D projection of a 3D point cloud acquisition. Resolution to be generated from the point cloud A point cloud is a 3D structure that consists of the data points collected by a 3D vision system during acquisition. points within the region of interest.
-
Select the Projection Mode used to create the sample image from the point cloud.
Note: The Auto-Tune button is only available after you have trained one or more images, in the final steps of this procedure. Projection Modes Description
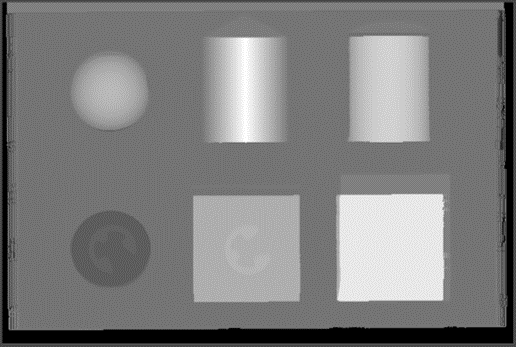
Height Map The Height Map projection mode creates three-dimensional height maps.
This projection mode collects 3D data points within the ROI, and transforms them into a 2D height data representation, where the assigned height value for each pixel signifies the average distance between the points within the corresponding XY cell and the bottom of the ROI box. The projection mode fixes minor irregularities in the height data and directly maps it to an 8-bit image. In this mapped image, pixel values range from 0 (bottom of the box) to 255 (top of the box).
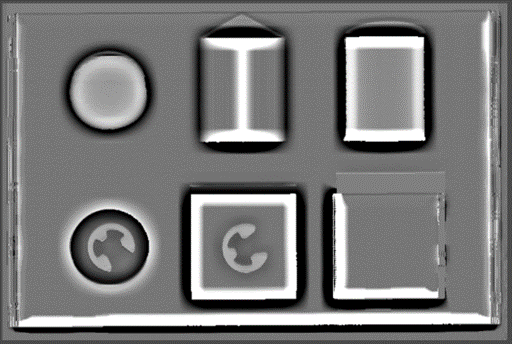
Vertical Shape Change The Vertical Shape Change projection mode identifies 3D depth along the Z-axis.
The Vertical Shape Change projection mode is designed to identify and visualize 3D structural variations along the Z-axis. This projection mode collects 3D data points within the ROI, and projects them into a 2D data representation, highlighting changes in the orientation of surface normals relative to the Z axis.
This projection mode amplifies edges, but is less sensitive to height changes.
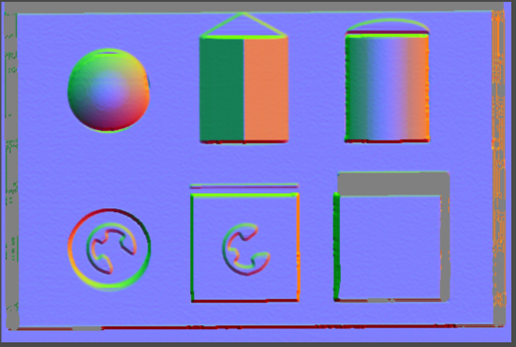
Shape Change The Shape Change projection mode identifies 3D depth along the XYZ axes, and visualizes 3D structural variations along the X, Y, and Z axes.
This projection mode collects 3D data points within the ROI, and projects them into a 2D data representation. Changes are color coded relative to the X, Y, and Z axes in order to highlight changes in the orientation of surface normals.
This projection mode amplifies edges, but is less sensitive to height changes.
Automatic Height Map The Automatic Height Map projection mode creates three-dimensional height maps, automatically selecting the height range.
This projection mode collects 3D data points within the ROI, and transforms them into a 2D height data representation, similar to the Height projection mode. This mode automatically sets the height range for optimal results.
Flex Inspect The Flex Inspect projection mode identifies overall 3D structural flaws or locates 3D structures.
This projection mode estimates the shape of the local background as a freeform surface, and shows height changes relative to the local background shape. This mode computes the average height in the neighborhood of a pixel according to the user-defined feature width, and overlays the difference between pixel height and the computed average height onto the projection.
Curve Inspect The Curve Inspect projection mode identifies 3D structural flaws on curved surfaces or locates 3D structures.
This projection mode estimates the shape of the local background as a curved surface, and shows height changes relative to the local background shape. This mode computes a curved surface model based on pixel neighborhoods according to the user-defined feature width, and overlays the difference between pixel height and the surface model onto the projection.
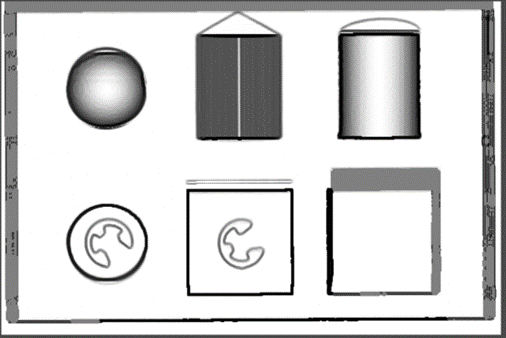
Greyscale The Greyscale projection mode identifies overall 2D surface flaws.
This projection mode is a direct mapping technique from the height data addressed to an 8-bit image. In this mapping, the value of each pixel in the resulting image corresponds directly to the intensity of the original 3D points.
-
Adjust the Confidence Threshold which specifies the minimum confidence score (0 to 100) to determine pixel to class assignment.
Note: The larger the Confidence Threshold is, the more strict the class assignment is. -
Set the Pass/Fail Range Limits by defining the minimum and maximum values. The Found value is the number of segments found in the region of interest within the limits.
-
Toggle the Invert Pass/Fail bar to change the Found value to the number of segments outside of the limits.
-
For the Advanced Settings, click the Settings icon in the right corner.
 Run Parameters and Result Sorting Descriptions
Setting Description Run Parameters Advanced parameter properties.
Confidence Threshold Specifies the minimum confidence score (0 to 100) to determine pixel-to-class assignment. The larger the threshold, the more strict the class assignment is. Minimum Volume Minimum volume that blobs must have to be included, in real-world units. Maximum Volume Maximum volume that blobs must have to be included, in real-world units. Minimum Area Minimum area that blobs must have to be included, in real-world units. Maximum Area Maximum area that blobs must have to be included, in real-world units. Minimum Height Minimum height that blobs must have to be included, in real-world units. Maximum Height Maximum height that blobs must have to be included, in real-world units. Orientation Bounding box alignment options of result 3D blobs.
-
Aligned to Box
-
Aligned to Z
-
Aligned to Background Surface
Note: When using the Aligned to Background Surface setting, the orientation of results might not align with the image. When you select this setting, result graphics identify the center of mass instead of the bounding box.Note: The geometry included in the result determines the volume, the area, and the height. For example, if the result only includes the top flat surface of a feature, the height is 0. To ensure that the height and volume reflect the size of the feature, not just the top surface, include at least a part of the base of the feature in the result.Result Sorting Advanced sorting properties.
Sort Key Select the sorting key for the sorting rule from the drop-down menu. Sort Order Choose Ascending or Descending as the sorting order for the sorting rule. Sort Tolerance The threshold to determine is two or more results are tied, in real-world units or degrees. If they are tied, they can be sorted by a subsequent sort. This only takes effect when multiple sorting rules are applied. Sort Reference Select the sorting reference for the sorting rule from the drop-down menu. -
-
Start labeling images.
You can label in the following ways:
-
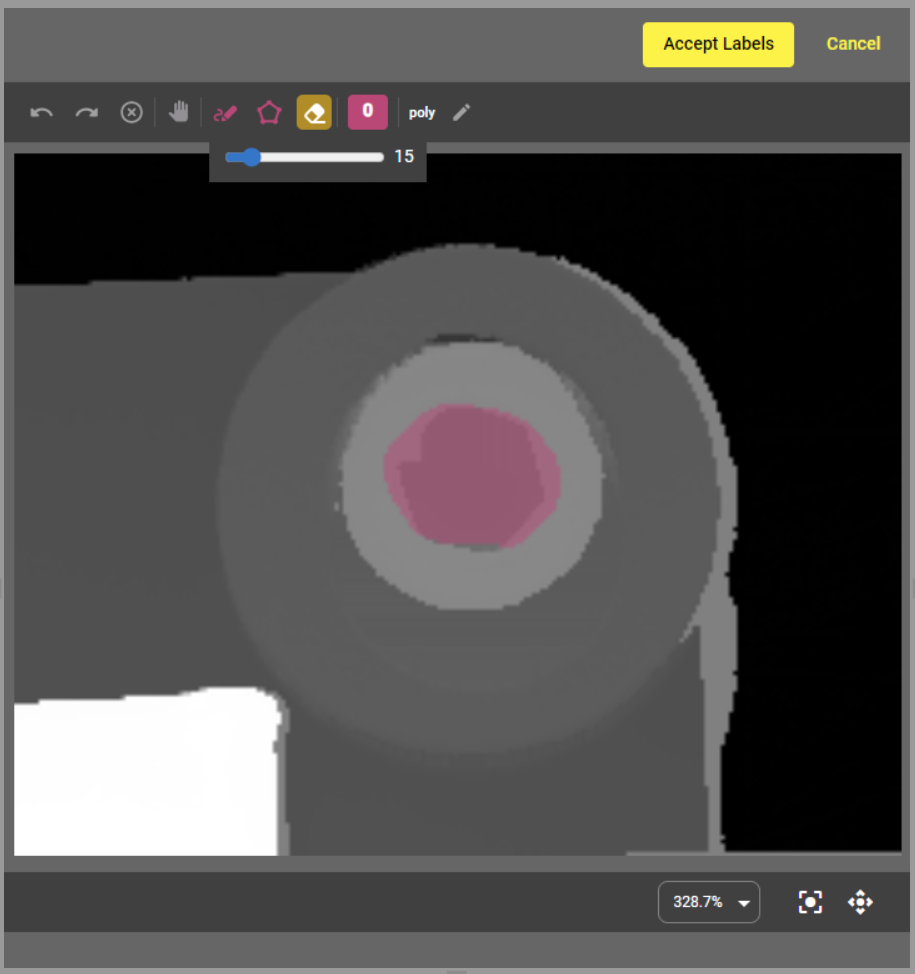
Use the Pen tool by holding down the left mouse button to color the areas you want to mark.
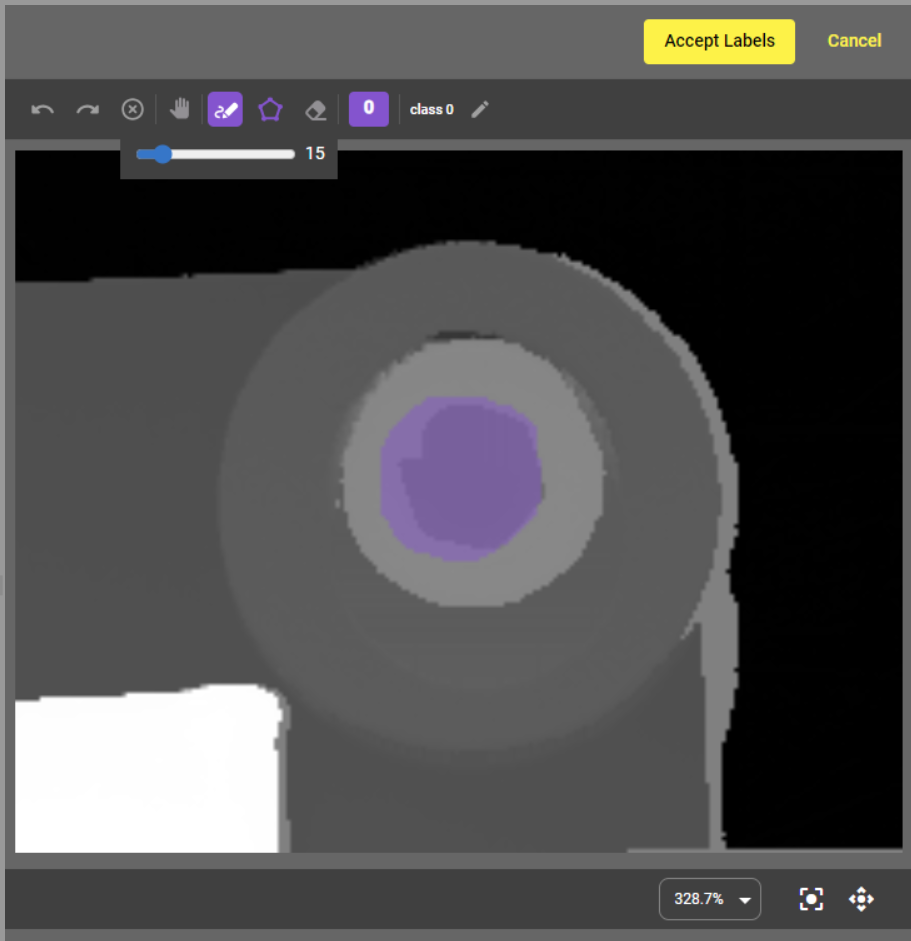
-
Use the Polygon tool by clicking around the edge of an area or feature to draw lines. Double-clicking closes up the lines and creates a colored polygon for you.
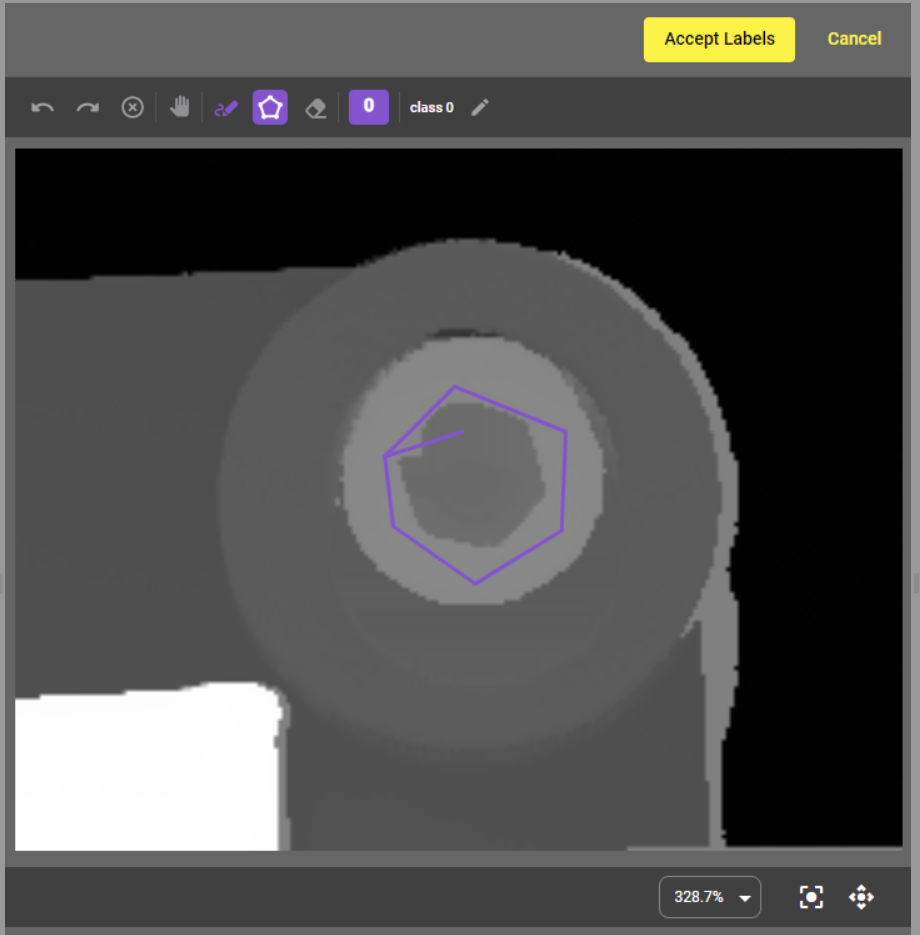
If you do not like the label you created, you can use the Undo and Redo buttons, delete part of the markings with the Eraser tool, or all of them with the Clear button. The Clear button deletes every label in the image, regardless of the class.
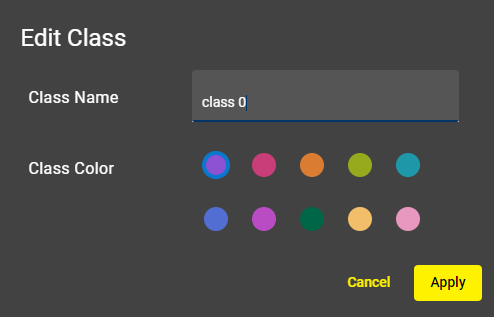
You can rename the class or give the class a new color by clicking on the Edit Class button.
-
-
Click Accept Labels to train the image.
-
Show the next image to the tool. At this point, the tool makes a prediction, meaning that the tool tries to find the patterns that you marked in the previous images.
Note: Cognex recommends that you label at least five images. The more images you train, the higher the quality of your output is. -
Fine-tune your labeling if needed.
For example, there can be false predictions in your image. You can delete these faults by clicking Label to reopen the editor and using the Eraser tool before accepting the changes.
-
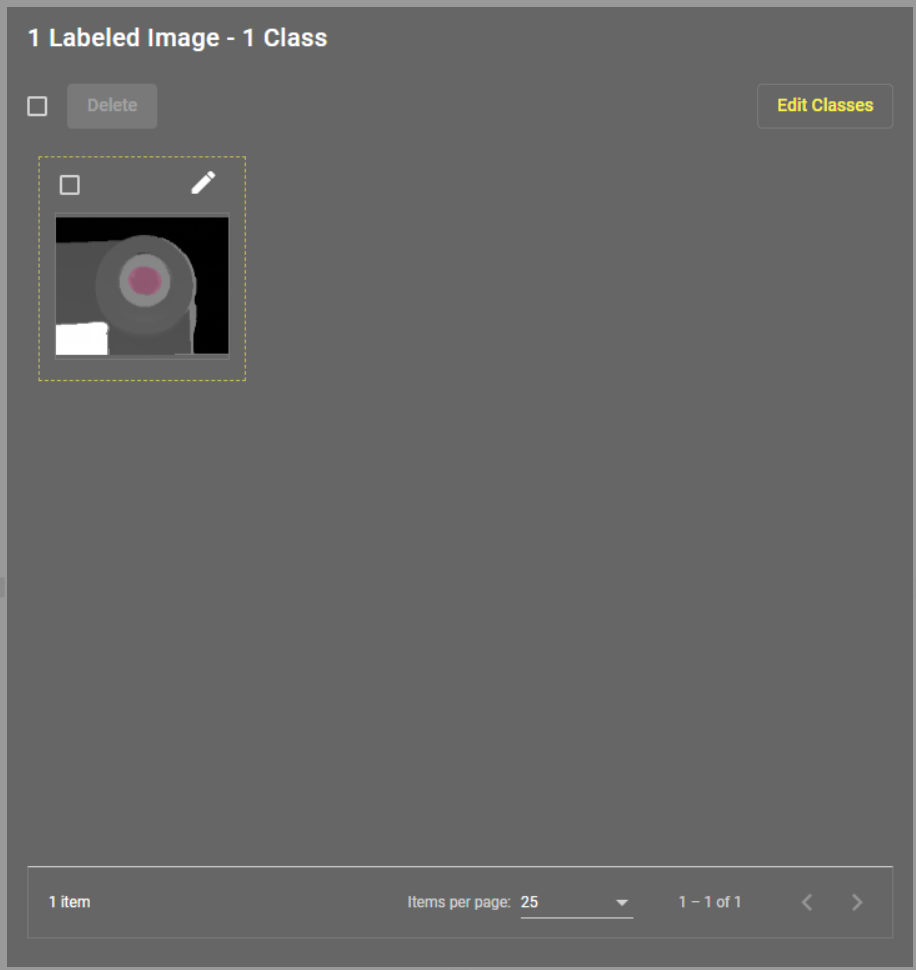
You can view your trained images in the sample viewer. To reach the sample viewer window, click the Edit button on the right.
-
Select Auto-Tune if you want the system to choose the Projection Mode best suited for your application, automatically adjusting the projection settings for more accurate results.
-
In the sample viewer, you can correct and finetune the trained images by clicking on the Edit button. You can also delete them by clicking on the Delete button, or you can edit the classes.
After successful training, the Segment 3D tool can produce accurate results in new acquisitions.