Charts
For Spreadsheet Vision Tools that generate a chart, the chart opens in a separate, dockable Charts tab of the Output Window. You can open this window either through the View > Charts option of the Menu Bar, or by clicking the Charts tab of the Output Window.
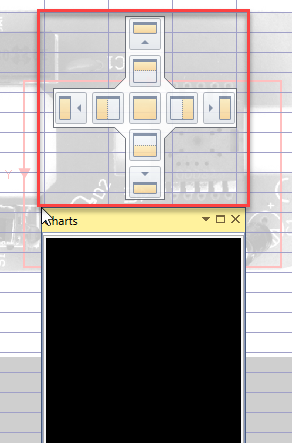
The Charts window can be undocked and dragged out to become a separate floating window. To reattach the undocked window,
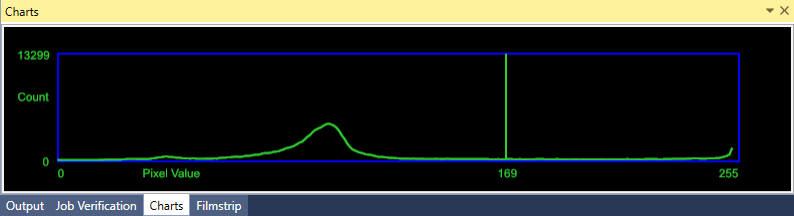
When the Show parameter of the function is configured to display the chart, the chart displays in the Charts
If you make changes to the function generating the chart, the chart automatically updates to reflect the change.
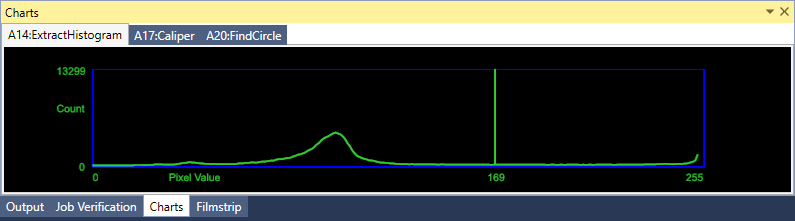
When there are multiple functions that generate charts in a spreadsheet, the functions are tabbed. Selecting the function in the spreadsheet displays the chart in the Charts
The following
| Function | Show parameter |
| Caliper |
|
| ExtractHistogram |
|
| FindCircle |
|
| FindCurve |
|
| FindLine |
|
| FindMultiLine |
|
| FindSegment |
|
| InspectEdge |
|
| InspectEdgeTrainBeadPath |
|


