ViDiClassify
With ViDiClassify tool, you can identify and classify an object, or the entire scene in an image.
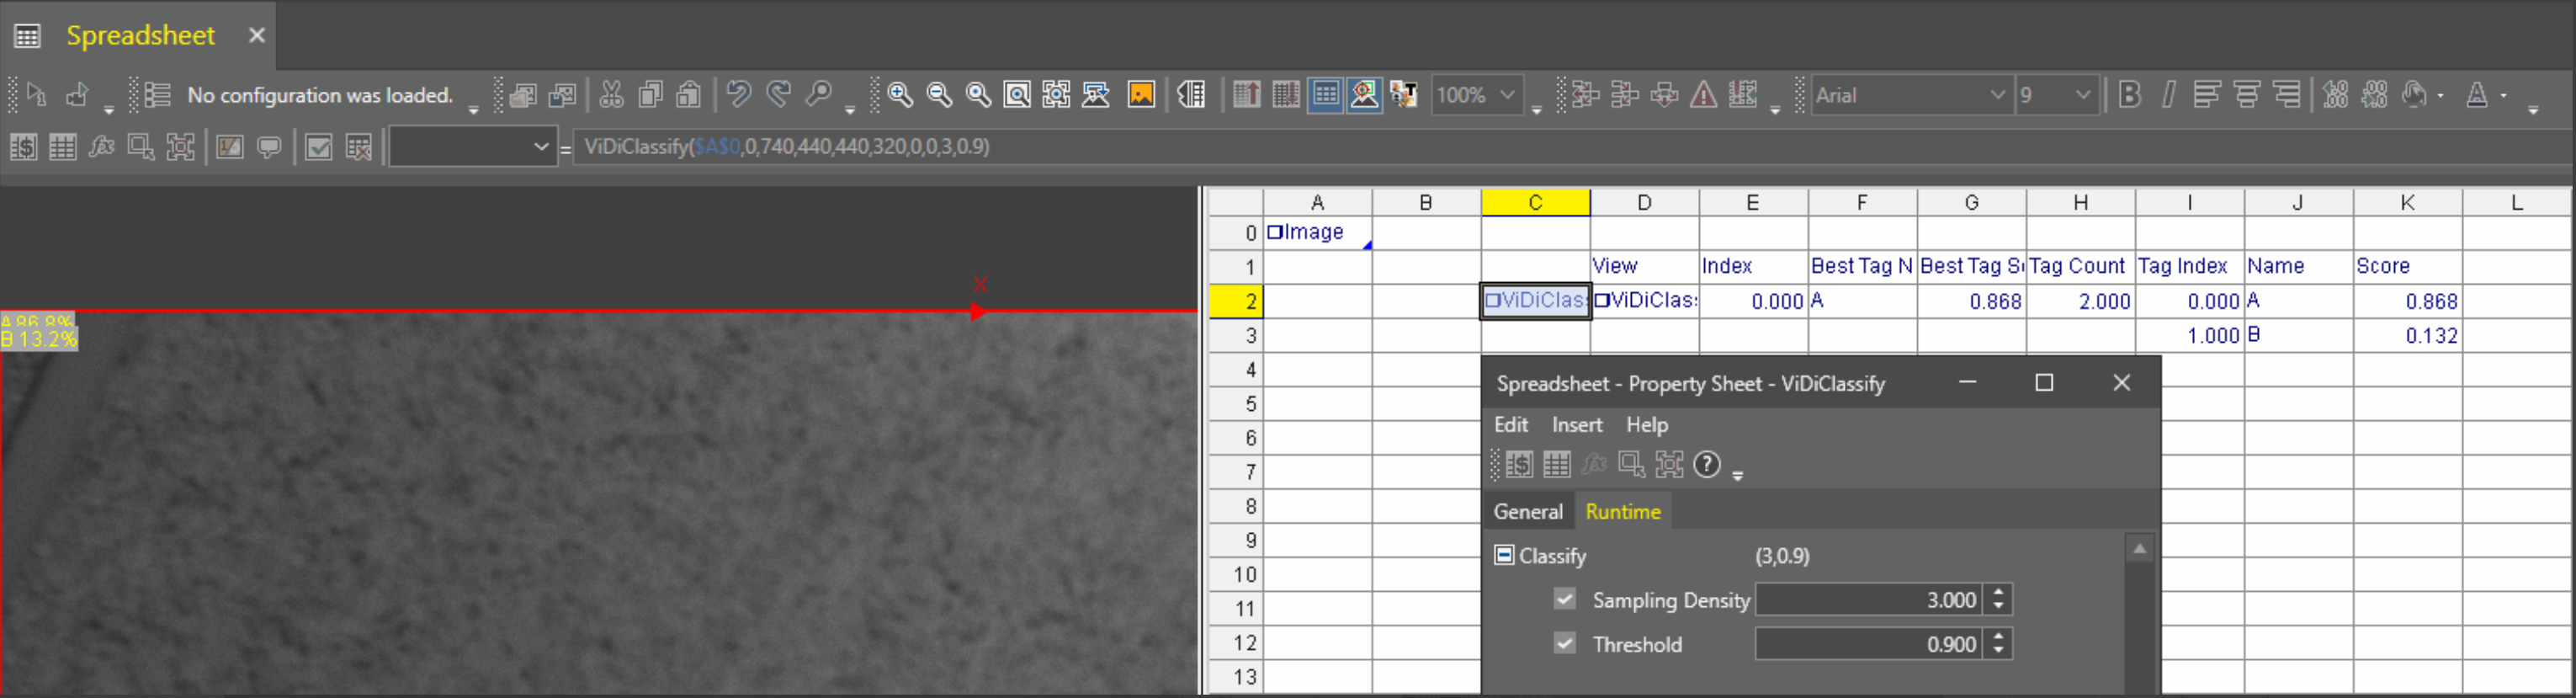
After training the tool, ViDiClassify assigns a tag onto the inspected image, then based on this tag, ViDiClassify assigns a class to the inspected image. The tag is represented by a label, and ViDiClassify gives the tag a percentage declaring the certainty the tool has for the classification assigned for the tag.
- ViDiClassify tool supports one or more input fixtures. Based on the number of input fixtures, ViDiClassify creates a view in the results.
- ViDiClassify tool supports overriding previously set runtime parameters. For overriding, use the Runtime tab of the property sheet.
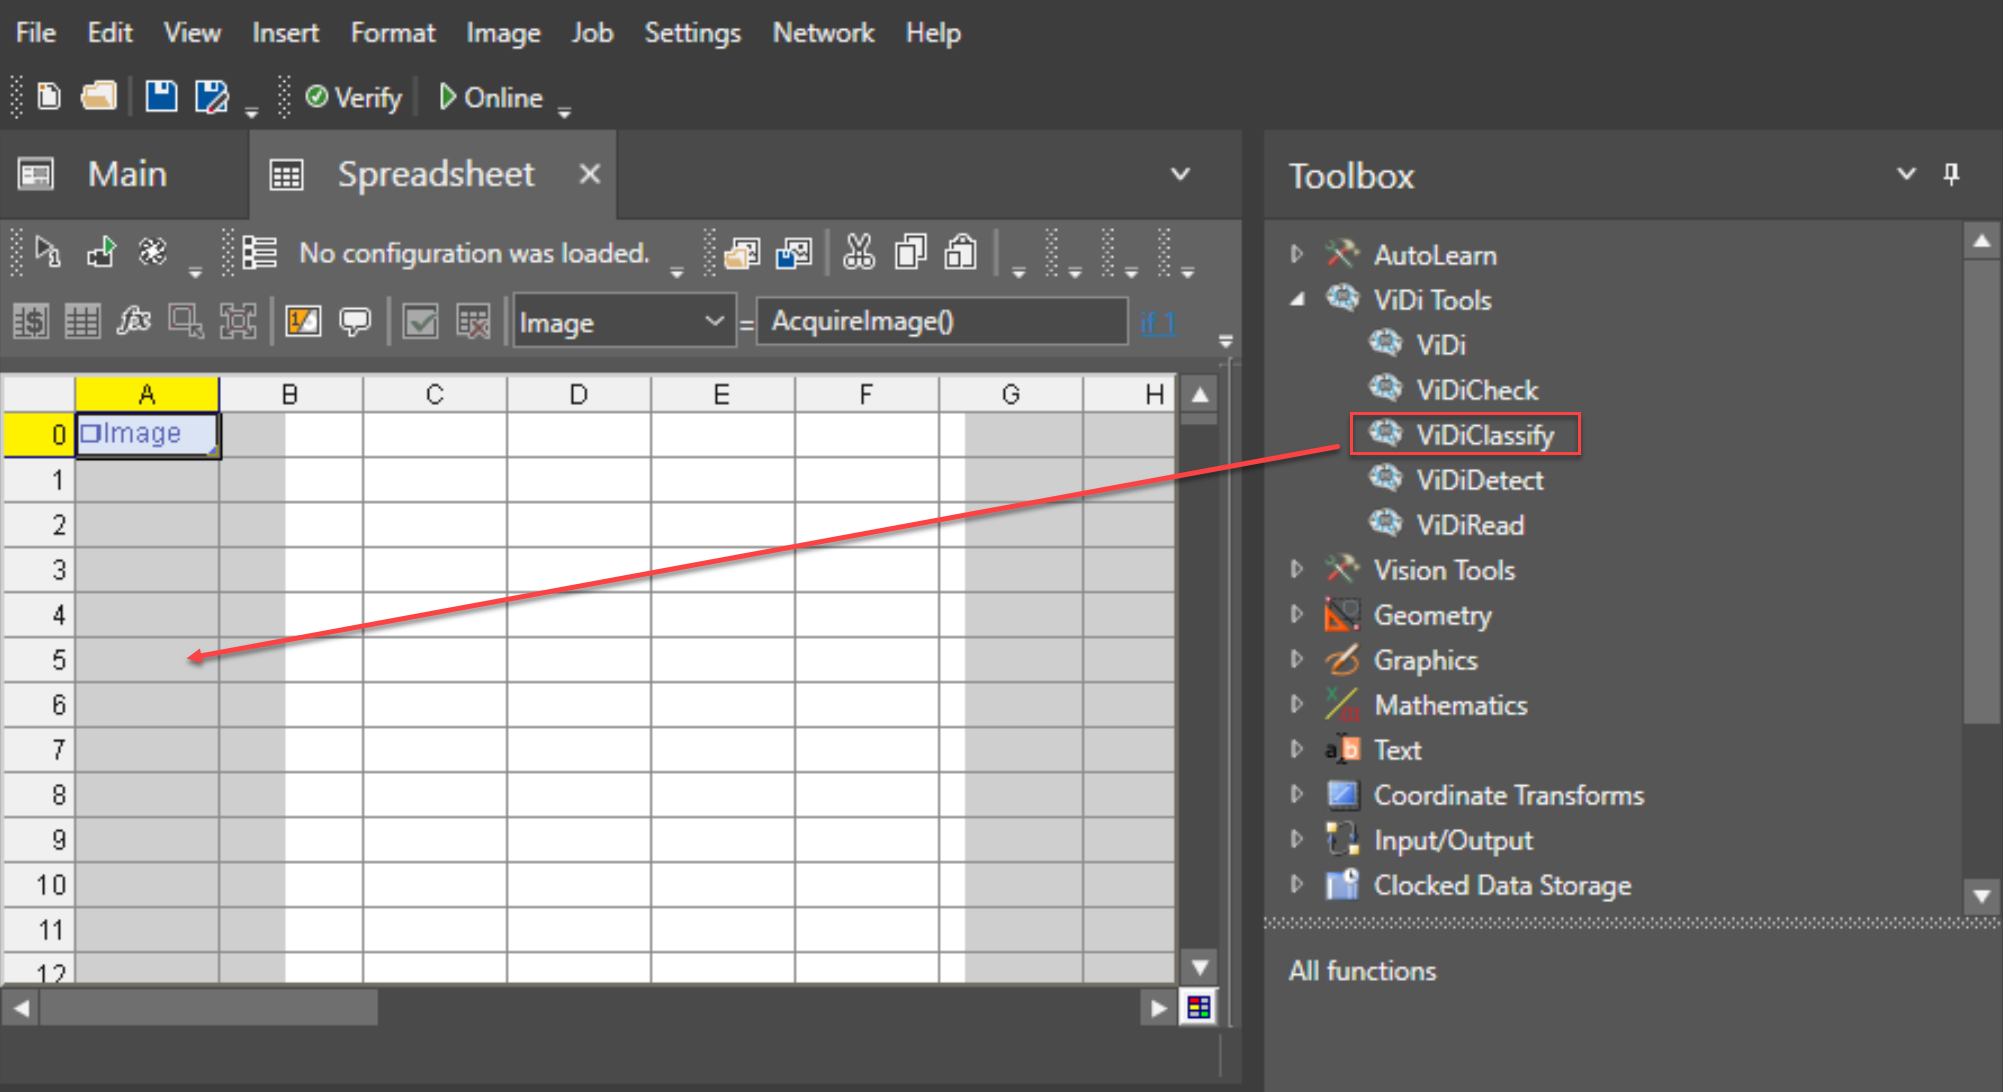
To use ViDiClassify:
- Select the ViDiClassify tool from under ViDiTools in the Toolbox.
-
Drag and drop the ViDiClassify tool to the desired cell of the Spreadsheet.
-
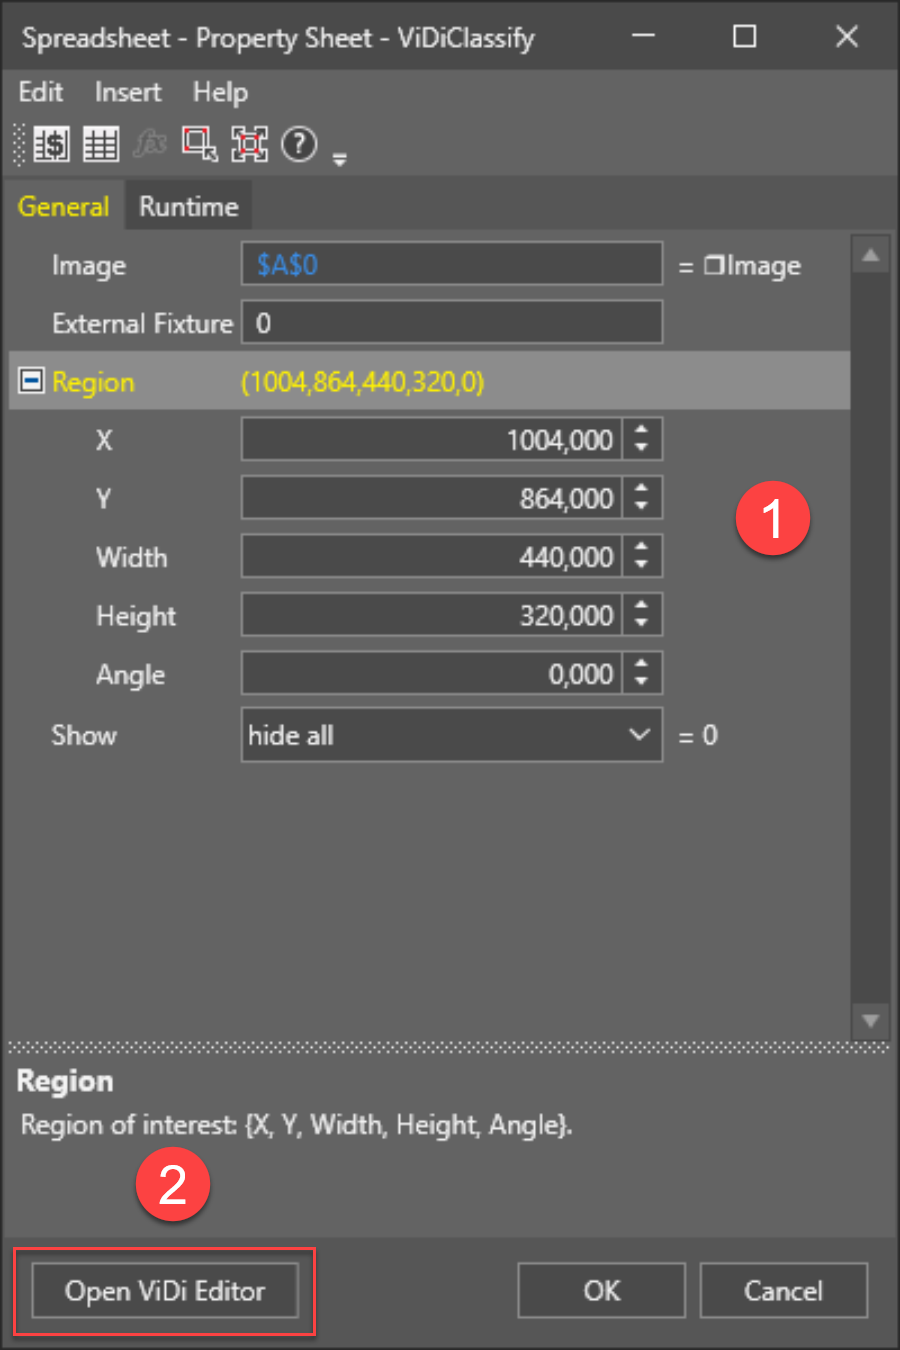
Set Fixture options and edit Region if necessary, then open the ViDi Editor.
-
Add the images that will comprise your training set.
-
Label the features that you expect to make up your model.
Tip: Tag your image files with descriptive names or numbering schemes to help when you label the images. -
Make sure that you have labeled all of the images with a classification tag.
-
Press the Brain icon to train the tool.
ViDiClassify Inputs
The following table summarizes the possible ViDi Classify input parameters which you can add on the General tab.
| Parameter | Description |
|---|---|
| Image |
Input image for processing. The output is usually A0 InputImage() but Filter() and ScaleImage() functions are also supported. |
| Fixture | External Fixture Cell Reference used for positioning of the tool. |
| Region | Defines the region of interest (Position, Size, Rotation) where the ViDiClassify Tool runs. |
| Show |
Specifies which outputs from the tool are visible in the Sheet view:
|
Runtime Tab
Allows access to ViDi Processing Tool Parameters that can be modified while the job is online. These parameters do not require that the tool be retrained. You can drag and drop these parameter to the spreadsheet, and publish them to the HMI for operator interaction.
ViDiClassify Outputs
| Returns | A ViDiClassify data structure, or #ERR if any of the input parameters are invalid. | ||||||||||||||||||||||||||||||||||||||||||||
| Results |
After a ViDiClassify function is inserted into the spreadsheet, a results table can be created, based on the ViDi Results Vision Data Access Functionsby right-clicking on the function's data structure and selecting Insert Getters.
|
For more information, see Green Classify Tool