Results Table
The Results Table, viewable in the EasyBuilder View's Run Job step, displays information about each tool in the active job, allowing you to monitor or troubleshoot the tools as the job runs.
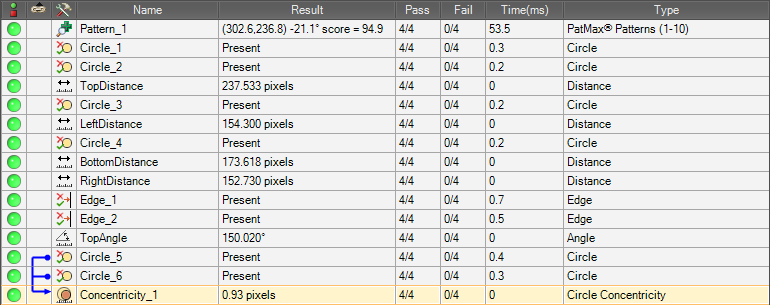
For each tool, the Results Table displays its pass/fail status, tool icon, name, type, result, pass total and fail total as well as the amount of time, in milliseconds, needed to run the tool.
The Result column shows the following results.
| In-Sight Models | Results |
|---|---|
| In-Sight 2000-110, 2000-120 & 2000-120C Vision Sensors | Pass/Fail status |
| In-Sight 2000-130 & 2000-130C Vision Sensors | Measurement and Counting Inspection tools: Standard Results (Numeric Data) Other tools (including Location tools): Pass/Fail status |
| In-Sight Vision Systems and In-Sight 2000 Series 23X Sensors (23M, 230) | Standard Results |
In addition, when a tool is selected in the table, the dependent relationships among the selected tool (highlighted in orange) and other tools in the job are displayed, allowing you to determine if a tool failure is related to the failure of another tool. A dependency exists when a tool references another tool. Each dependency consists of two parts: a precedent and a dependent, which are connected by a line. The precedent refers to the source of the data (that is, the tool providing the input) and is represented by a circle; the dependent is the destination of the data (that is, the tool receiving the output) and is represented by an arrow. Blue dependency graphics indicate that the selected tool is the destination; green indicates that the selected tool is the source.
An abbreviated version of the table is displayed in the Results tab of the Palette. In both the Run Job step and the Results tab, you can right-click on a tool in the table to edit it.