What is Edge Detection?
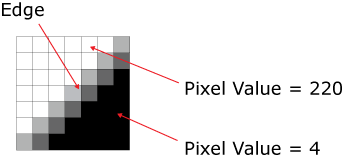
The In-Sight Edge Tool functions detect edges by examining a region of interest (ROI) for discontinuities in pixel polarity, i.e. an area in the image where there is an abrupt change between light and dark (or vice versa) pixels. An edge might only span two or three pixels, or several.
Edge Example
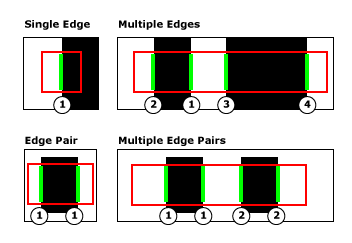
Edges can be comprised of a single edge, or a pair of edges, which consists of two transitions from dark to light or light to dark. The following figure shows the types of edges:
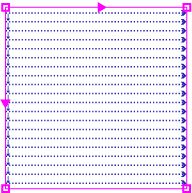
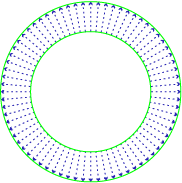
When an Edge Tool, such as a Caliper, FindLine or FindCircle function, is inserted into the spreadsheet, the ROI is scanned for any pixel value discontinuities. The figure below illustrates the direction in which rectangular and annular regions are scanned for edge features. In the rectangular region, the scan direction (the scan direction is indicated by the two directional arrows) starts from the upper-most left-hand corner, and proceeds to the end of the right-hand side, and then continues the pattern until it reaches the bottom right-hand corner.
Scan Directions - Rectangular and Annular Regions
During this process, a greyscale histogram is computed of the ROI, and areas defined by high contrast (the difference between greyscale values found within the ROI) and meeting the other specified parameters, define an edge.
The edge response chart (displayed when the Show parameter is set to show all: input, result, and chart) displays the first derivative of the greyscale values found in the ROI; with peaks and valleys representing the major edge transitions, as shown in the figure below. The Accept Thresh/Minimum Contrast parameter is used to set a minimum peak height (contrast threshold). With this set, any peaks that are lower than the minimum peak height are excluded from the results. This allows the inspection analysis to be limited to just those edges in the image that are of a certain magnitude. Use the function's edge response chart to determine the correct contrast threshold.
Edge Response Chart Example
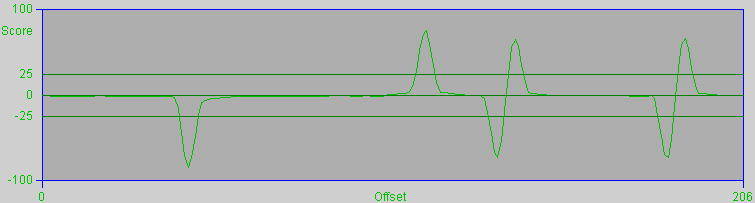
- The Score axis is defined by the Score (100 and -100) and the Accept Threshold parameter set for the tool. Peaks (or positive scores) indicate that the edge transitions from dark to light, while valleys (or negative scores) indicate that the edge transitions from light to dark (a score of 0 indicates no edge was detected).
- The Offset axis refers to the ROI of detecting the edge feature, where 0 represents the beginning of the region and the right-hand value marks the maximum width (in pixels) of the region. The apex of the peaks or valleys along the Offset axis indicates the position of the found edge within the ROI.
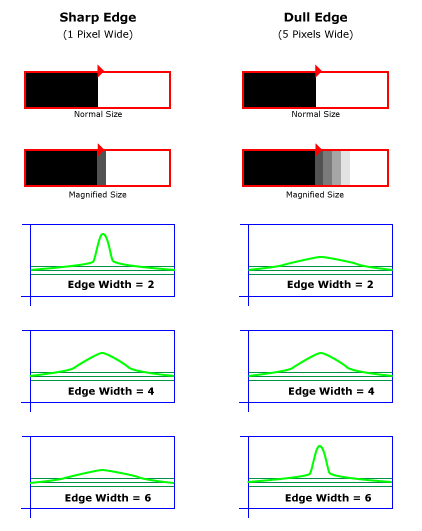
Edge Width - Filtering Edges
The Edge Width parameter is used to remove noise from the input image, and accentuate the peaks of the edge profiles. The size of the Edge Width parameter should be specified such that the size closely matches the size of the edges in the image, and the peak is sharp and steep, versus low and gradual. The size of an edge is how many pixels wide the edge is; an edge can be sharp, in which case the edge only spans a pixel or two, or edges can be dull, in which case they might span several pixels. Specifying an Edge Width setting that is close to the edge size allows the function to produce stronger edge peaks in the image. Whereas specifying an Edge Width setting that is too large or too small will produce broad, low peaks in the image.
Edge Results
Once the edge has been defined, the Edge Tool function will automatically create an Edges data structure and a result table that contains data about the defined edge. The information returned can be utilized by other In-Sight Vision Tools as a fixture input, or used by other Edge Tool functions to further extrapolate edge related data.