Math Tool Functions
The Math tool provides a comprehensive dictionary of mathematical operations:
-
Clocked Data Storage functions store a stream of values from a cell over time. Each function returns a single value selected from the stream of values whenever the specified event updates the spreadsheet.
- With Geometry and Measurement functions, you can easily compute the distance between standard geometric constructs, including circles, points, and line segments.
- Graphics:
- Control functions insert interactive elements into the spreadsheet that allow users to make simple configuration changes to a job without having to use the Insert Function dialog or property sheet.
- Image functions plot graphic overlays on top of the image.
- Mathematics functions:
- Logic functions provide boolean algebraic and conditional testing capabilities. For all Logic functions 0 value means FALSE result and any non-zero result means TRUE.
- Lookup functions allow you to search a range of values for a maximum, minimum, or index number; return X and Y coordinates, and #ERR data; suppress #ERR cells to avoid error propagation through multiple functions .
- Arithmetic functions provide various mathematical functions such as absolute value, power, truncation, rounding, and random number generation.
- Statistics functions return maximum, minimum, mean (average), and standard deviation data for a group of values.
- Trigonometry functions provide functions for (and relating to) sine, cosine, tangent, pi, degrees, and radians.
- Operator functions provide relational operators including =, <>, >, <, >=, and <=.
-
String functions format alphanumerical data for display and for communications between the In-Sight vision system and a remote device.
-
Vision Data Access (VDA) functions can extract individual values from data structures, functions and other cell references.
- Vision Tools functions can extract and process image features for further data analysis and decision making.
List of functions
Expand the following function description tables for a list of functions in each function group:
| Function | Description | ||||||||||||||||||||||||||||||||||||||||||||||||||||||
|---|---|---|---|---|---|---|---|---|---|---|---|---|---|---|---|---|---|---|---|---|---|---|---|---|---|---|---|---|---|---|---|---|---|---|---|---|---|---|---|---|---|---|---|---|---|---|---|---|---|---|---|---|---|---|---|
| Accumulate |
Syntax: Accumulate(Event,Value,Reset,Preset) Sums a value over an infinite interval. The function returns the integral of a data stream sampled on each occurrence of the specified event. Inputs
Outputs
|
||||||||||||||||||||||||||||||||||||||||||||||||||||||
| ClockedMax |
Syntax: ClockedMax(Event,Value,Reset,Preset) Samples a stream of values over an infinite interval, then returns the maximum value sampled from the stream during that interval. Inputs
Outputs
|
||||||||||||||||||||||||||||||||||||||||||||||||||||||
| ClockedMin |
Syntax: ClockedMin(Event,Value,Reset,Preset) Samples a stream of values over an infinite interval, then returns the minimum value sampled from the stream during that interval. Inputs
Outputs
|
||||||||||||||||||||||||||||||||||||||||||||||||||||||
| ClockedSum |
Syntax: ClockedSum(Event,Value,Reset,Preset) |
||||||||||||||||||||||||||||||||||||||||||||||||||||||
| Count |
Syntax: Count(Event,Max Value,Reset,Preset) Counts events over an infinite interval. The function returns the Preset value plus the number of events that occurred since the last reset. Inputs
Outputs
|
||||||||||||||||||||||||||||||||||||||||||||||||||||||
| CountPassFail |
Syntax: CountPassFail(Event,Value,CountWhen Offline,ResetEvents.Manual,ResetEvents.Online,ResetEvents.Job Load) Counts and returns passes, failures and total events for a given referenced value. Inputs
Outputs
Vision Data Access FunctionsThe following Vision Data Access functions are automatically inserted into the spreadsheet to create the result table..
|
||||||||||||||||||||||||||||||||||||||||||||||||||||||
| Latch |
Syntax: Latch(Event,Value) Stores (latches) an input value on the specified event. Inputs
Outputs
|
||||||||||||||||||||||||||||||||||||||||||||||||||||||
| LatchString |
Syntax: LatchString(Event,"String") Stores (latches) an alphanumeric input string on the specified event. Inputs
Outputs
|
||||||||||||||||||||||||||||||||||||||||||||||||||||||
| Maximum |
Syntax: Maximum(Event,Value,Reset,Preset) Samples a stream of values over an infinite interval, then returns the maximum value sampled from the stream during that interval. Inputs
Outputs
|
||||||||||||||||||||||||||||||||||||||||||||||||||||||
| Minimum |
Syntax: Minimum(Event,Value,Reset,Preset) Samples a stream of values over an infinite interval, then returns the minimum value sampled from the stream during that interval. Inputs
Outputs
|
||||||||||||||||||||||||||||||||||||||||||||||||||||||
| ShiftRegister |
Syntax: ShiftRegister (Event,Value,Number of Steps,Reset) Implements a shift-register array, or data "stream", into which a cell's values are buffered after each event. Note: After a reset,
the first value that is read fills the shift-register.
Inputs
Outputs
Vision Data Access FunctionsThe following Vision Data Access functions are automatically inserted into the spreadsheet to create the result table.
Additional data elements can be accessed using the following Vision Data Access functions:
|
|
Type |
Function | Description | ||||||||||||||||||||||||||||||||||||||||||||||||||||||||||||||
|---|---|---|---|---|---|---|---|---|---|---|---|---|---|---|---|---|---|---|---|---|---|---|---|---|---|---|---|---|---|---|---|---|---|---|---|---|---|---|---|---|---|---|---|---|---|---|---|---|---|---|---|---|---|---|---|---|---|---|---|---|---|---|---|---|
|
Fit Functions Note: If a Geometry function is using world coordinate data as a reference, the resulting graphics will not be displayed correctly.
|
CircleFromNPoints |
Syntax: CircleFromNPoints(Point X 0,Point Y 0,Point X 1,Point Y 1,Point X 2,Point Y 2,...,Point X N,Point Y N,Show) Fits a circle using three or more input points. Inputs
Outputs
Vision Data Access FunctionsThe following Vision Data Access functions are automatically inserted into the spreadsheet to create the result table.
Additional data elements can be accessed using the following Vision Data Access functions:
|
||||||||||||||||||||||||||||||||||||||||||||||||||||||||||||||
| LineFromNPoints |
Syntax: LineFromNPoints(Point X 0,Point Y 0,Point X 1,Point Y 1,[...Point X N,Point Y N,Show]) Fits a line using two or more input points. Inputs
Outputs
Vision Data Access FunctionsThe following Vision Data Access functions are automatically inserted into the spreadsheet to create the result table.
Additional data elements can be accessed using the following Vision Data Access functions.
|
|||||||||||||||||||||||||||||||||||||||||||||||||||||||||||||||
| Measure | PointToCircle |
Syntax: PointToCircle(Point.X,Point.Y,Circle.X,Circle.Y,Circle.Radius,Show) Computes the minimum distance from a point to the nearest point on a circle. If the point is inside the circle, distance is reported as a negative number. Inputs
Outputs
Vision Data Access FunctionsThe following Vision Data Access functions are automatically inserted into the spreadsheet to create the result table.
|
||||||||||||||||||||||||||||||||||||||||||||||||||||||||||||||
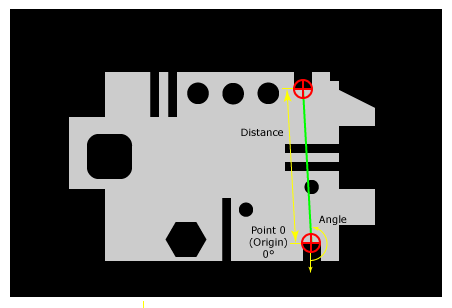
| PointToLine |
Syntax: PointToLine(Point.X,Point.Y,Line.X 0,Line.Y 0,Line.X 1,Line.Y 1,Show)
Computes the minimum distance from a point to a line. In this example, the PointToLine function is measuring the distance between a point and a line. The point is the origin, and the angle is calculated based on its position relative to the line. Inputs
Outputs
Vision Data Access FunctionsThe following Vision Data Access functions are automatically inserted into the spreadsheet to create the result table.
|
|||||||||||||||||||||||||||||||||||||||||||||||||||||||||||||||
| PointToPoint |
Syntax: PointToPoint(Point 0.X,Point 0.Y,Point 1.X,Point 1.Y,Show)
Computes the directed distance between two points. In this example, the PointToPoint function is measuring the distance between two points. The angle is calculated based on the first point's position relative to the second.
Inputs
Outputs
Vision Data Access FunctionsThe following Vision Data Access functions are automatically inserted into the spreadsheet to create the result table.
|
|||||||||||||||||||||||||||||||||||||||||||||||||||||||||||||||
| PointToPointAngle |
Syntax: PointToPointAngle(Point 0.X,Point 0.Y,Point 1.X,Point 1.Y) Computes the angle between two points. Inputs
Outputs
Note: Unlike most
other Measure functions in the Geometry
category, PointToPointAngle does not insert a Dist data structure
or result table into the spreadsheet.
|
|||||||||||||||||||||||||||||||||||||||||||||||||||||||||||||||
| PointToPointDistance |
Syntax: PointToPointDistance(Point 0.X,Point 0.Y,Point 1.X,Point 1.Y) Computes the distance between two points. Inputs
Outputs
Note: Unlike most
other Measure functions in the Geometry
category, PointToPointDistance does not insert a Dist data
structure or result table to the spreadsheet.
|
| Type | Function | Description | |||||||||||||||||||||||||||||||||||
|---|---|---|---|---|---|---|---|---|---|---|---|---|---|---|---|---|---|---|---|---|---|---|---|---|---|---|---|---|---|---|---|---|---|---|---|---|---|
|
Control Note: Make sure to use the 'Acquired' keyword to specify the current image.
|
Button |
Syntax: Button(Name,Trigger) Inserts a labeled push button control into the spreadsheet. Optionally, a button press can be configured to signal a spreadsheet event trigger. Tip: To access the
property sheet for a Button,
right-click the button and select Edit
Function.
Note:
Inputs
Outputs
|
|||||||||||||||||||||||||||||||||||
| CheckBox |
Syntax: CheckBox(Name) Inserts a labeled checkbox control into the spreadsheet. Note: To access the
property sheet for a CheckBox,
right-click the CheckBox and select Edit
Function.
Inputs
Outputs
ExampleA spreadsheet is configured as follows: A3=CheckBox("On") A4=A3 Cell A4 references cell A3 to determine the on/off status of the "On" checkbox. When the checkbox is cleared, the value 0.000 is returned in cell A4. When the checkbox is selected, the value 1.000 is returned. |
||||||||||||||||||||||||||||||||||||
| EditFloat |
Syntax: EditFloat(Min,Max) Inserts a floating-point edit control into the spreadsheet. The control behaves like other interactive numeric input controls. Note: To access the
property sheet for an EditFloat
control, right-click the control and select Edit
Function.
Inputs
Outputs
|
||||||||||||||||||||||||||||||||||||
| EditInt |
Syntax: EditInt(Min,Max) Inserts an integer edit control into the spreadsheet. The control works like all other In-Sight interactive numeric input controls. Note: To access the
property sheet for an EditInt
control, right-click the control and select Edit
Function.
Inputs
Outputs
|
||||||||||||||||||||||||||||||||||||
| EditString |
Syntax: EditString(Max String Length) Inserts an integer edit control into the spreadsheet. The control works like all other In-Sight interactive numeric input controls. Note: To access the
property sheet for an EditInt
control, right-click the control and select Edit
Function.
Inputs
Outputs
|
||||||||||||||||||||||||||||||||||||
| ListBox |
Syntax: ListBox("String0","String1","String2",...) Inserts a drop-down list control in the spreadsheet. Note: Since the ListBox
function can accept a variable number of strings, this function is not
configured through a property sheet.
This function can be configured directly in the cell or in the Formula
Bar on the Job Edit
toolbar.
Inputs
Outputs
ExampleA spreadsheet is configured as follows: A3=ListBox("Item1","Item2","Item3") A4=A3 The function in cell A3 creates the list control, with "Item1" as the default selection. The index value of Item1 is 0, so the value in cell A4 will be 0.000.
If the user selects "Item2", then the value in cell A4 will be 1.000. If "Item3" is selected, the value in cell A4 will be 2.000. Vision Data Access FunctionsAdditional data elements can be accessed using the following Vision Data Access functions:
|
||||||||||||||||||||||||||||||||||||
|
Image Note: Make sure to use the 'Acquired' keyword to specify the current image.
|
PlotCircle |
Syntax: PlotCircle(Circle.X,Circle.Y,Circle.Radius,Name,Color,Show) Plots a circle on the image. Inputs
Outputs
|
|||||||||||||||||||||||||||||||||||
| PlotCross |
Syntax: PlotCro(Cross.X,Cross.Y,Cross.Angle,Cross.High,Cross.Wide,Name,Color,Show) Plots a cross on the image. Inputs
Outputs
|
||||||||||||||||||||||||||||||||||||
| PlotLine |
Syntax: PlotLine(Line.X 0,Line.Y 0,Line.X 1,Line.Y 1,Name,Color,Show,Start Point Adornment,End Point Adornment) Plots a line segment in the image. Inputs
Outputs
|
||||||||||||||||||||||||||||||||||||
| PlotPoint |
Syntax: PlotPoint(Point.X,Point.Y,Name,Color,Show) Plots a Point crosshair in the image. Inputs
Outputs
|
||||||||||||||||||||||||||||||||||||
| PlotString |
Syntax: PlotString(String,Point.X,Point.Y,Color,Show) Plots a text string on the image. Tip: After inserting
the PlotString function into the spreadsheet, highlight the function's
spreadsheet cell and use the Format
Cells dialog to format the Font, Font Size and Font Style of the PlotString
cell and the plotted text string.
Inputs
Outputs
|
||||||||||||||||||||||||||||||||||||
 control.
 the result is TRUE if one – and
only one – of the bits is TRUE. The
result is FALSE if 2 or more bits are equal.)
the result is TRUE if one – and
only one – of the bits is TRUE. The
result is FALSE if 2 or more bits are equal.)| Function | Description | ||||||||||||||||||||||||||||||||||||
|---|---|---|---|---|---|---|---|---|---|---|---|---|---|---|---|---|---|---|---|---|---|---|---|---|---|---|---|---|---|---|---|---|---|---|---|---|---|
| Code |
Syntax: Code(Text) Returns the integer value corresponding to the ASCII code for the first character in a string. |
||||||||||||||||||||||||||||||||||||
| Concatenate |
Syntax: Concatenate(Arg1, [Arg2, Arg3, ...]) Returns the concatenation of multiple alphanumeric text strings. Numeric arguments are automatically converted to text. Note: The In-Sight 2000-110/120/120C vision sensor is only capable of returning Pass/Fail data as Output data, and the return value is converted to 0 or 1.
|
||||||||||||||||||||||||||||||||||||
| Exact |
Syntax: Exact(Text1, Text2) Returns 1 if Text1 and Text2 are identical, else 0. Note: Exact is case-sensitive.
|
||||||||||||||||||||||||||||||||||||
| Find |
Syntax: Find(FindText, SrcText, [StartChar]) Returns the indexed position of the string Text1 contained in the string Text2. The search for Text1 starts at the optionally-specified StartChar position within Text2. Note:
Find is case-sensitive.
|
||||||||||||||||||||||||||||||||||||
| Left |
Syntax: Left(Text, NumChars) Returns the leftmost number of characters (NumChars) from a Text string. |
||||||||||||||||||||||||||||||||||||
| Len |
Syntax: Len(Text) Returns the number of characters (bytes) in a Text string. |
||||||||||||||||||||||||||||||||||||
| Lower |
Syntax: Lower(Text) Returns Text converted to lowercase. |
||||||||||||||||||||||||||||||||||||
| Mid |
Syntax: Mid(Text, StartChar, NumChars) Returns the Text starting from the indexed StartChar position in the alphanumeric string, for as many characters as specified by NumChars. |
||||||||||||||||||||||||||||||||||||
| Replace |
Syntax: Replace(SrcText, StartChar, NumChars, NewText) Returns SrcText, modified by NewText at the indexed position StartChar. |
||||||||||||||||||||||||||||||||||||
| Right |
Syntax: Right(Text, NumChars) Returns the rightmost number of characters (NumChars) from a Text string. |
||||||||||||||||||||||||||||||||||||
| Stringf |
Syntax: Stringf(Format-string, [Text or Value, ...]) Returns a text string constructed using a "C" library standard Format-string. Tip: The FormatString
function supports most Format-string parameters; use the FormatString
dialog to automatically configure the parameters within In-Sight Explorer.
Note:
Available Format-string parameters are:
The following Format-string parameters are used primarily for text formatting. For example, formatting the text of an email message in the WriteSMTP function:
|
||||||||||||||||||||||||||||||||||||
| Strtol |
Syntax: Strtol(IntegerText) Converts numeric characters (decimal, hexadecimal and octal) at the beginning of an alphanumeric string into an integer. Hexadecimal characters must begin with "0x"; octal characters must begin with "0". |
||||||||||||||||||||||||||||||||||||
| Substitute |
Syntax: Substitute(SrcText, OldText, NewText, [Instance]) Returns a text string constructed by substituting NewText for each occurrence of OldText in SrcText. If an optional Instance index is specified, then only that instance of the text will be replaced. |
||||||||||||||||||||||||||||||||||||
| Token |
Syntax: Token(Text, Delimiter, Instance) Returns the text located at the specified Instance index (occurrence) of a delimited string. The Delimiter must be enclosed in quotes (") in the function. |
||||||||||||||||||||||||||||||||||||
| Trim |
Returns Text stripped of leading and trailing spaces, leaving only a single space between words (if any). All control characters (Carriage Return, Line Feed, etc.) are also stripped. |
||||||||||||||||||||||||||||||||||||
| Upper |
Returns Text converted to uppercase. |
||||||||||||||||||||||||||||||||||||
| Value |
Returns the floating point value of NumericText. Subsequent non-numeric characters are ignored. |
 ("<STX>123<ESC>ABC<ETX>456").
| Type | Function | Description |
|---|---|---|
| AutoLearnClassify | GetClassLabel |
Syntax: GetClassLabel (Structure, [Index], [Model]) To use this function add classes and then add images to each of the classes Note: Make sure to use the 'Acquired' keyword to specify the current image.
GetClassLabel returns the string associated with each class. |
| GetModelHealth |
Syntax: GetModelHealth(Structure) To use this function add classes and then add images to each of the classes. Note: Make sure to use the 'Acquired' keyword to specify the current image.
GetModelHealth returns a number (0-100) that represents the ‘health’ of the model, which indicates how likely the model is to be correct. |
|
| GetNClasses |
Sytnax: GetNClasses(Structure) To use this function add classes and then add images to each of the classes. Note: Make sure to use the 'Acquired' keyword to specify the current image.
GetNClasses returns the number of classes- |
|
| GetNImages |
Syntax: GetNImages(Structure, [Index], [Model]) To use this function add classes and then add images to each of the classes. Note: Make sure to use the 'Acquired' keyword to specify the current image.
GetNImages returns the number of images in each class. |
|
| Blobs | GetAngle |
Syntax: GetAngle(Blobs, Index) Returns the angle of a blob's center of mass, relative to the center of the Region of Interest (ROI), that defines the area of the image that will be inspected. The center of mass of a blob represents the blob's balance point. If a sheet of a uniform material were cut out in the shape of the blob, the point upon which the blob would balance is the center of mass. Note that the center of mass of a blob might not actually lie within the blob itself. For example, assume that the black region depicted in the following image is a blob, identified by the ExtractBlobs function. The red dot represents the blob's center of mass.
The x-coordinate and y-coordinate of the center of mass are returned by the GetX and GetY Vision Data Access functions, respectively. |
| GetArea |
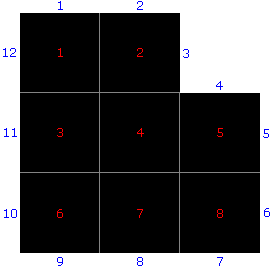
Syntax: GetArea(Blobs, Index) Returns the area (in pixels) of a blob. The area of a blob is calculated by counting the number of pixels contained within the blob. For example, consider the enlarged blob, shown in the following image:
By counting the pixels, we can see that this blob has an area of 8 pixels. |
|
| GetHeight |
Syntax: GetHeight(Blobs, Index) Returns the height of the indexed blob. |
|
| CircleFit | GetDistance |
Syntax: GetDistance(CircleFit, Index) Returns the distance between the indexed point and the circle. If the value is negative, the point is within the circle. If the indexed point is invalid, an #ERR is returned. |
| GetMaxDist |
Syntax: GetMaxDist(CircleFit) Returns the distance between the circle and the point farthest from the circle. If the value is negative, the point is within the circle. |
|
| GetMaxDistIndex |
Syntax: GetMaxDistIndex(CircleFit) Returns the index of the point farthest from the circle. |
|
| GetNPointsUsed |
Syntax: GetNPointsUsed(CircleFit) Returns the number of points used to fit the circle. |
|
| GetRadius |
Returns the radius of the circle. |
|
| GetSigma |
Returns the square root of the sum of the squares of the distances from the points to the circle divided by the number of points. |
|
| Clocked Data Storage | GetCount |
Syntax: GetCount(Delay) Returns the Count value from a Delay structure. |
| GetErrorCount |
Syntax: GetErrorCount(Count) Returns the incremental count of errors from a Count structure. The counter is incremented when the returned Value is less than zero. |
|
| GetFailCount |
Syntax: GetFailCount(Count) Returns the incremental count of failures from a Count structure. The counter is incremented when the returned Value is equal to zero. |
|
| GetPassCount |
Syntax: GetPassCount(Count) Returns the incremental count of passes from a Count structure. The counter is incremented when the returned Value is greater than zero. |
|
| GetTotalCount |
Syntax: GetTotalCount(Count) Returns the total number of passes, failures and errors from a Count structure. |
|
| Controls | GetString |
Syntax: GetString(ListBox) Returns the text string. If a cell containing the ListBox function is referenced, the text string that is currently selected from the list is returned. |
| Dist | GetDistance |
Syntax: GetDistance(Dist) Returns the Distance value. |
| GetErrorCode |
Syntax: GetErrorCode(Structure) GetErrorCode is a Vision Data Access function that returns a diagnostic code from most structures and functions. Note: If no error
code is available for the #ERR, GetErrorCode will return -1.
|
|
| GetErrorString |
Syntax: GetErrorString(Structure) GetErrorString is a Vision Data Access function that returns diagnostic information from most structures and functions. |
|
| GetNFound |
Syntax: GetNFound(Structure) Returns the number of patterns found. |
|
| GetValue |
Syntax: GetValue(Structure,[Index],[Color])
GetValue is a Vision Data Access function that returns information from the following structures:
|
|
| Inspect Edge | GetWidth |
Syntax: GetWidth(InspectEdgeWidth, Caliper Index) Returns the width value of the edge within the indexed Caliper; returns 0 if no edges are found within the indexed Caliper. |
| Linefit | GetChi2 |
Syntax: GetChi2(LineFit) Returns the sum of the squares of the distances from the points to the line. |
| GetDistance |
Syntax: GetDistance(LineFit, Index) Returns the distance between the indexed point and the line. |
|
| GetMaxDist |
Syntax: GetMaxDist(LineFit) Returns the point that is farthest from the line. |
|
| GetMaxDistIndex |
Syntax: GetMaxDistIndex(LineFit) Returns the index of the point that is farthest from the line. |
|
| GetX |
Syntax: GetX(Structure, [Index1], [Index2]) Returns an X coordinate. |
|
| GetY |
Syntax: GetY(Structure, [Index1], [Index2]) Returns a Y coordinate. |
|
| Stats | GetLatest |
Syntax: GetLatest(Stats) Returns the most recent value used to compute the statistics. |
| GetMax |
Returns the largest value used to compute the statistics. |
|
| GetMean |
Returns the mean (average) of the values. |
|
| GetMin |
Returns the smallest value used to compute the statistics. |
|
| GetErrorCount |
Returns the total number of errors from the referenced value. |
|
| GetNumSamples |
Returns the total number of samples used for calculations. |
|
| GetRange |
Returns the range between the minimum and maximum values. |
|
| GetSDev |
Returns the standard deviation of the values. |
|
| GetSum |
Returns the sum of the values. |
|
| GetVariance |
Returns the variance in the values. |
|
|
Structures Note: The Structure argument of the following functions must be a reference to the data structure returned by an Annulus, Circle, Cross, Fixture, Line, Mask, Point or Region function. The valid structures for each function are indicated in the description.
|
GetCurve |
Syntax: GetCurve(Structure) Returns the Curve value from the indexed Region structure |
| GetNPoints |
Syntax: GetNPoints(Structure) GetNPoints works with polygons and returns the number of points. |
|
| Timer | GetAllTime |
Syntax: GetAllTime(Image) Returns the time, in milliseconds, for the image to be acquired and the job to execute, or #ERR if the input value is invalid. Note:
|
| GetTime |
Syntax: GetTime(Cell1, [Cell2, ...]) Returns the time, in milliseconds, for a variable-length list of cells to execute or #ERR if the input value is invalid. If multiple cells are selected, the sum of all execution times is returned. |
|