ViDiELSegment
You can use the ViDi EL Segment tool for finding flaws or locating features. Use the Pen tool to mark the feature you want the ViDi EL Segment tool to find. You can create classes for the different features, so the ViDi EL Segment tool can search for several features at the same time. After training, the tool can predict the appearance of the features in the new images.
To add the ViDi EL Segment tool:
-
Drag and drop the ViDi EL Segment tool into the Spreadsheet.
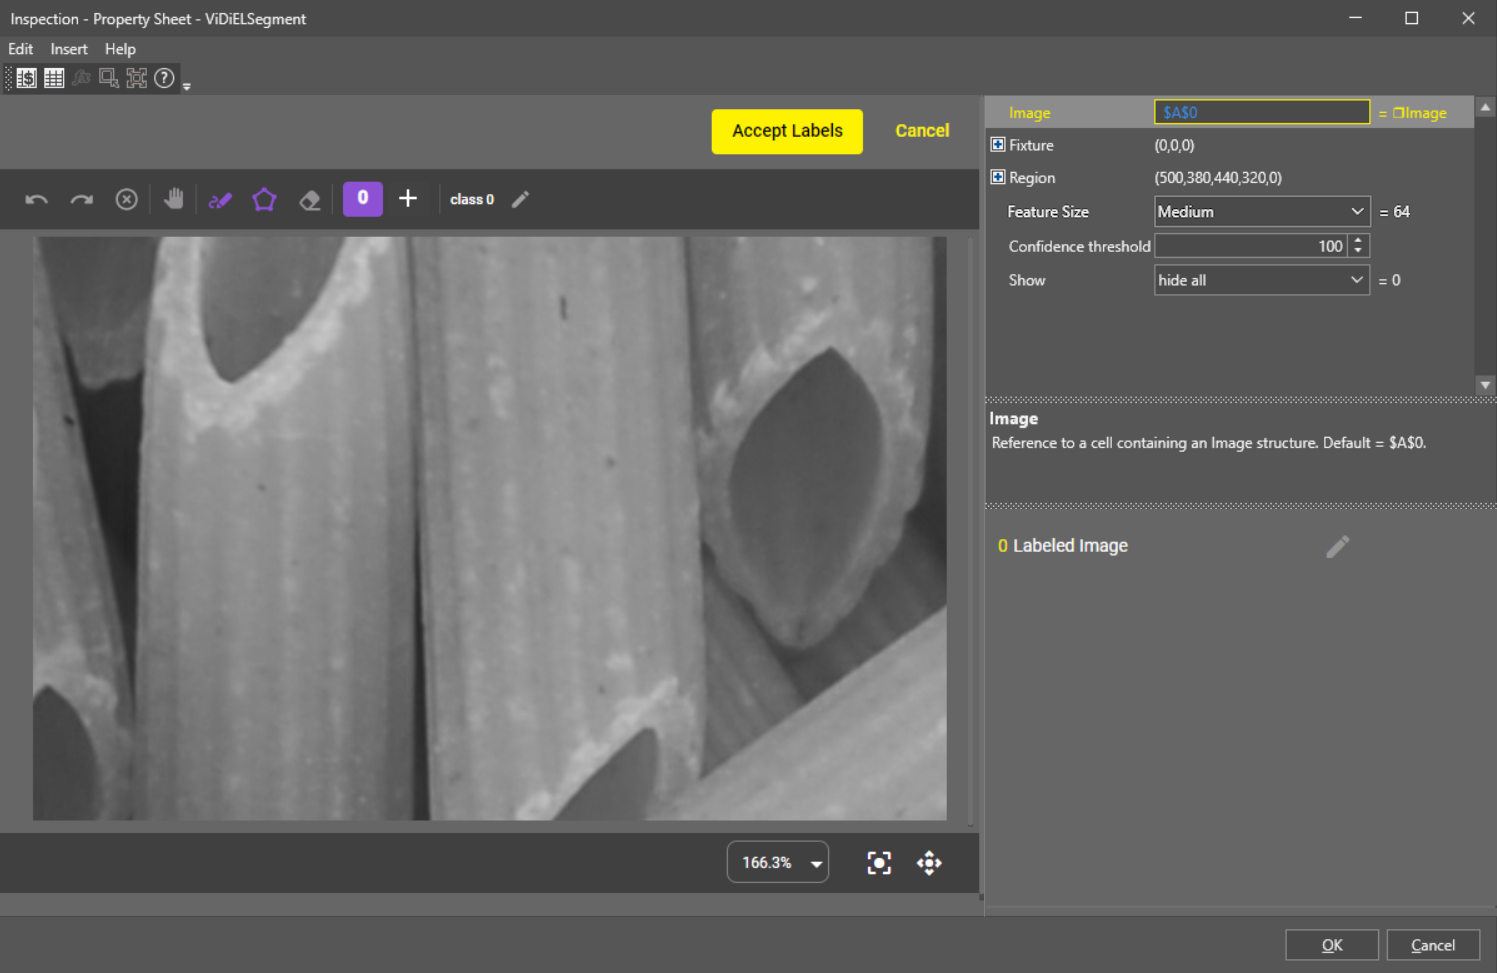
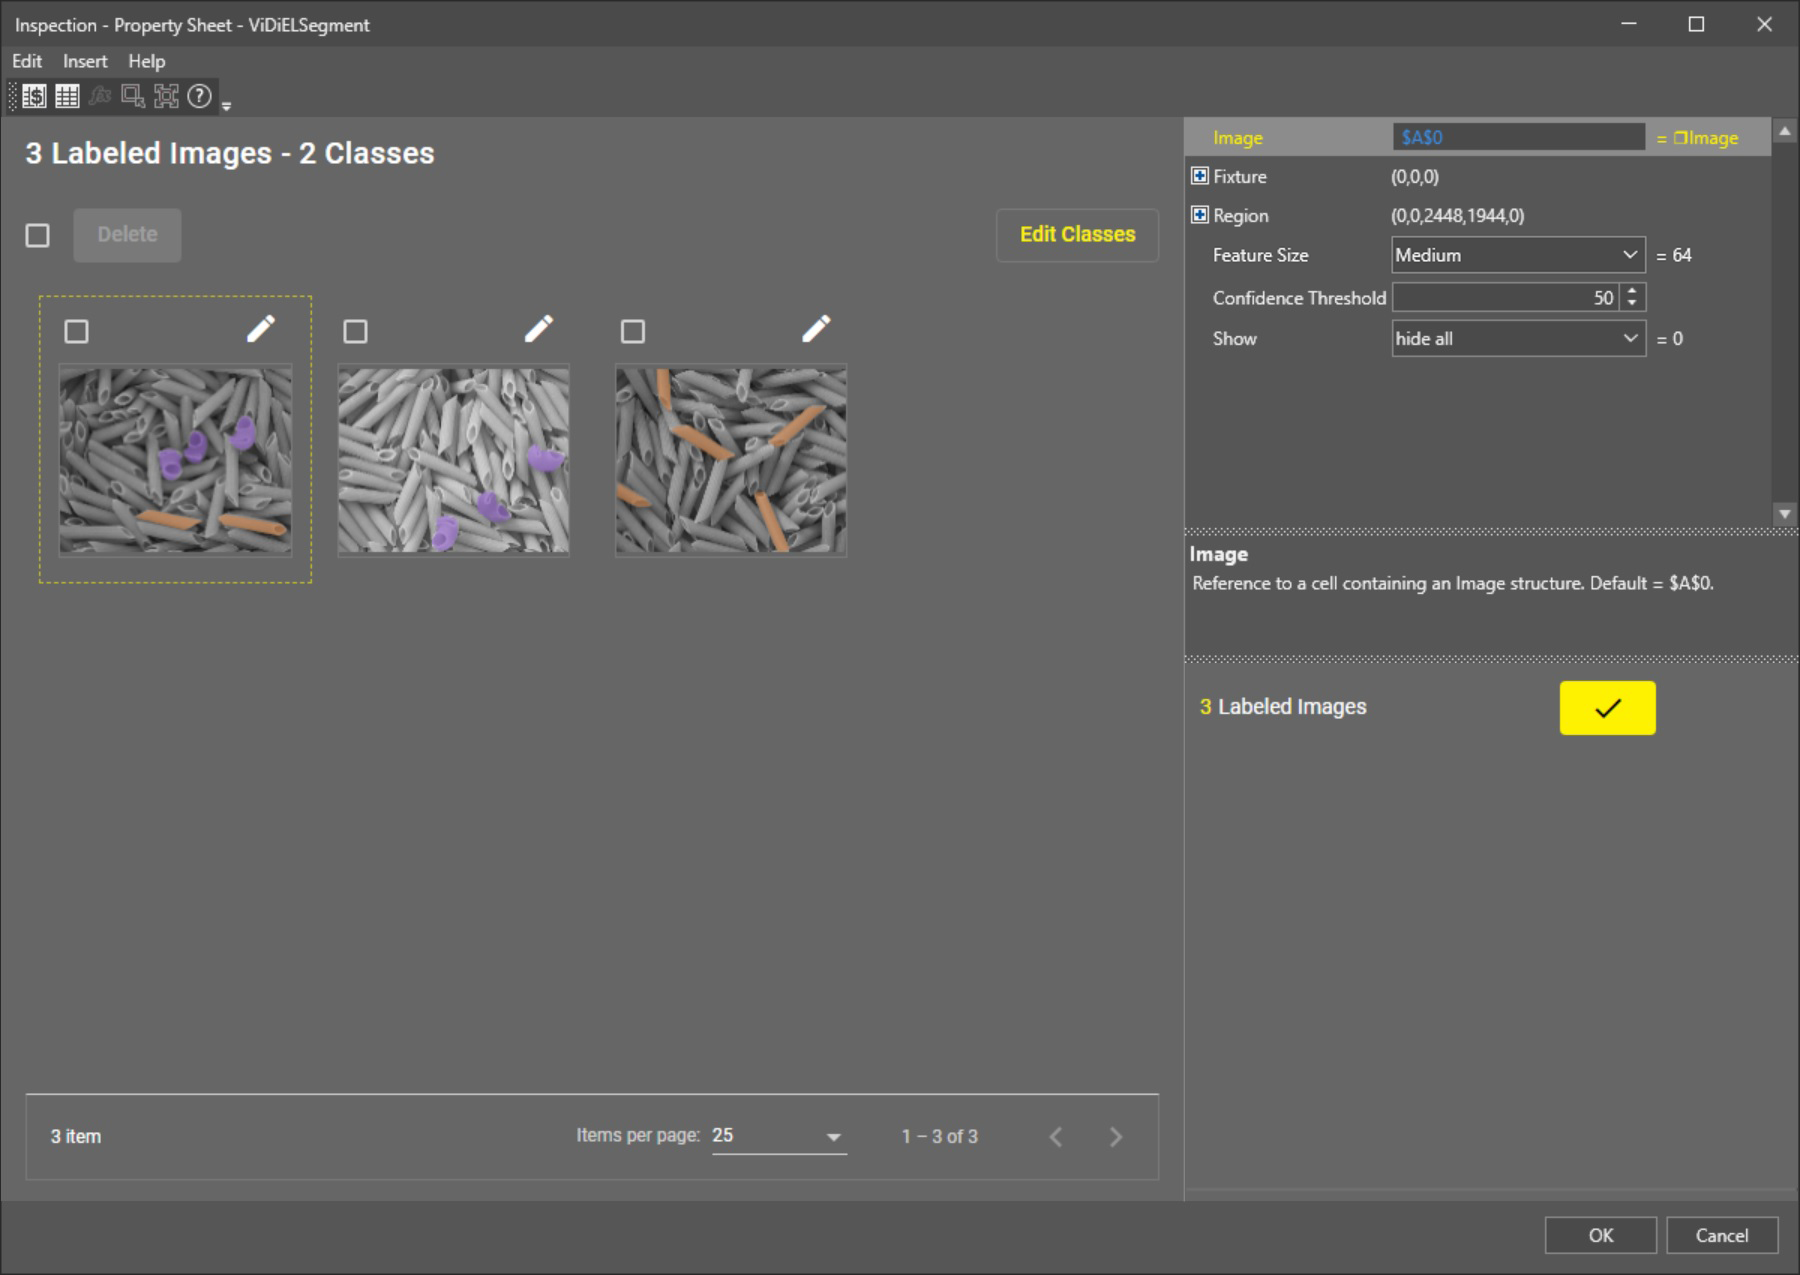
The property sheet pops up:
 Note: If you open the property sheet of an already trained ViDi EL Segment tool, the tool automatically shows predictions based on the training the tool received.
 -
To set up the ROI, double-click the Region parameter and adjust the red rectangle.
-
Start labeling images.
You can do the labeling in the following ways:
-
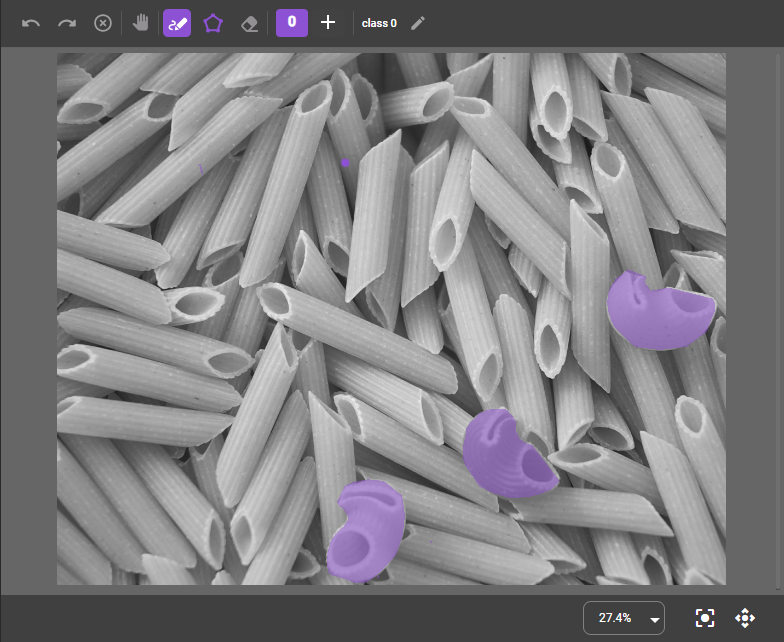
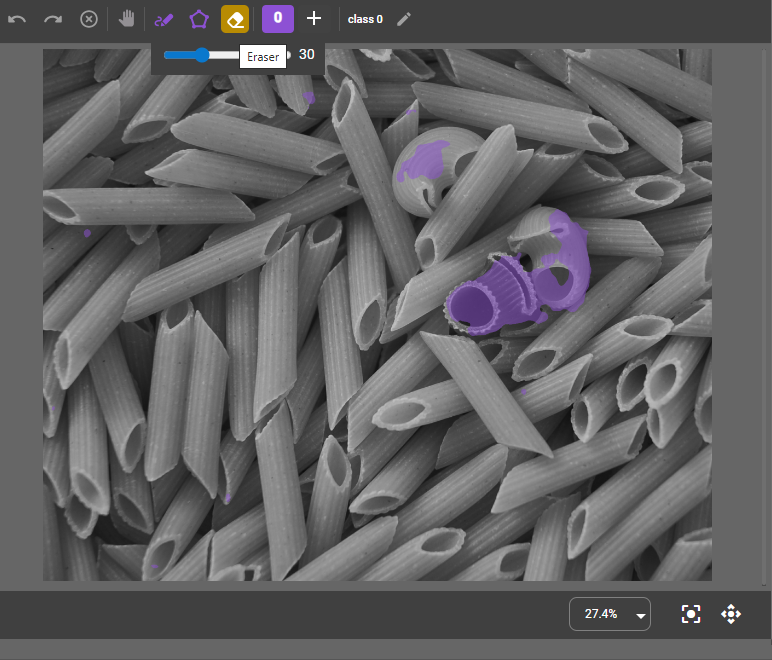
Use the Pen tool by holding down the left mouse button to color the areas you want to mark.
-
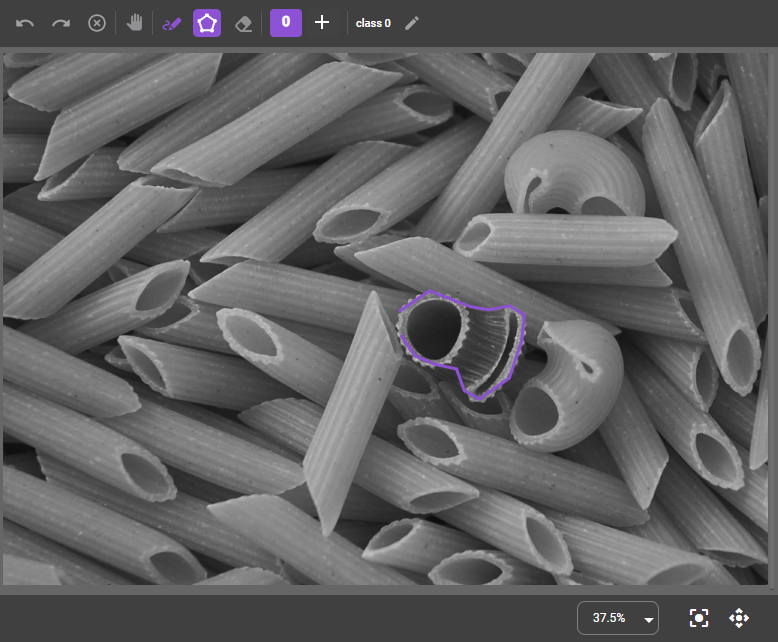
Use the Polygon tool by clicking around the edge of an area or feature to draw lines. Double-clicking closes up the lines and creates a colored polygon for you.
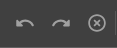
If you do not like the label you created, you can use the Undo and Redo buttons, delete part of the markings with the Eraser tool, or all of them with the Clear button. The Clear button deletes every label in the image, regardless of the class.
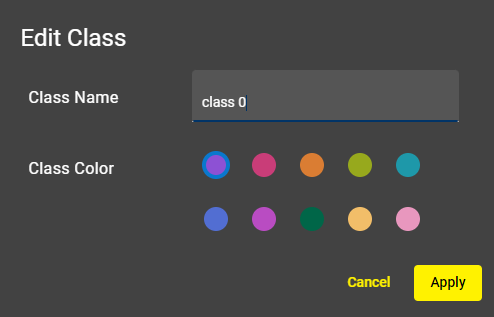
You can rename the class or give the class a new color by clicking on the Edit Class button.
-
-
Click Accept Labels to train the image.
Note: When training a large number of images in a single session, make sure to save the job intermittently to avoid losing progress. -
Show the next image to the tool. At this point, the tool makes a prediction, meaning that the tool tries to find the patterns that you marked in the previous images.
-
Finetune your labeling if needed.
For example, there can be false predictions in your image. You can delete these faults by using the Eraser tool before accepting the changes.
-
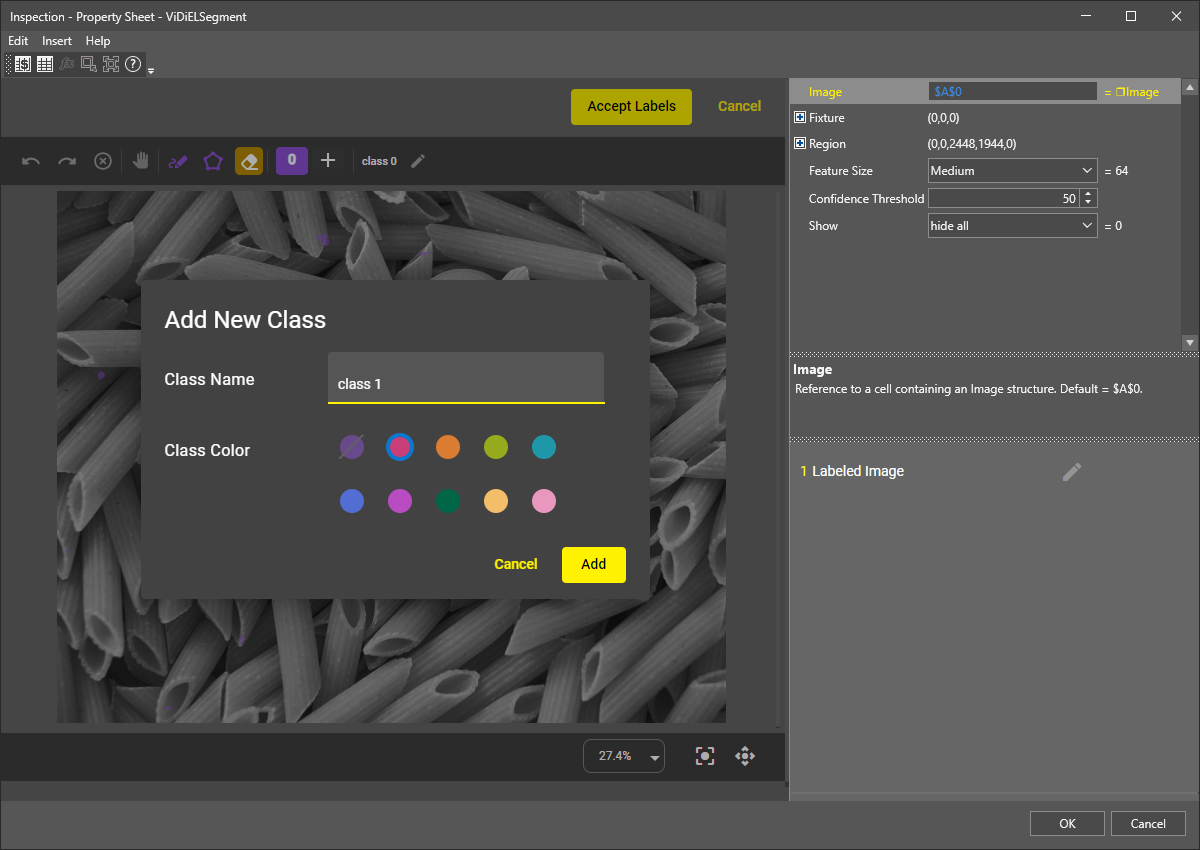
If needed, create more classes by clicking the Add Class button. Name your new class and pick a different color.
 Note: Label at least five images for each class. The more images you train, the higher the quality of your output is.
You can view your trained images in the sample viewer. To reach the sample viewer window, click the Edit button on the right.
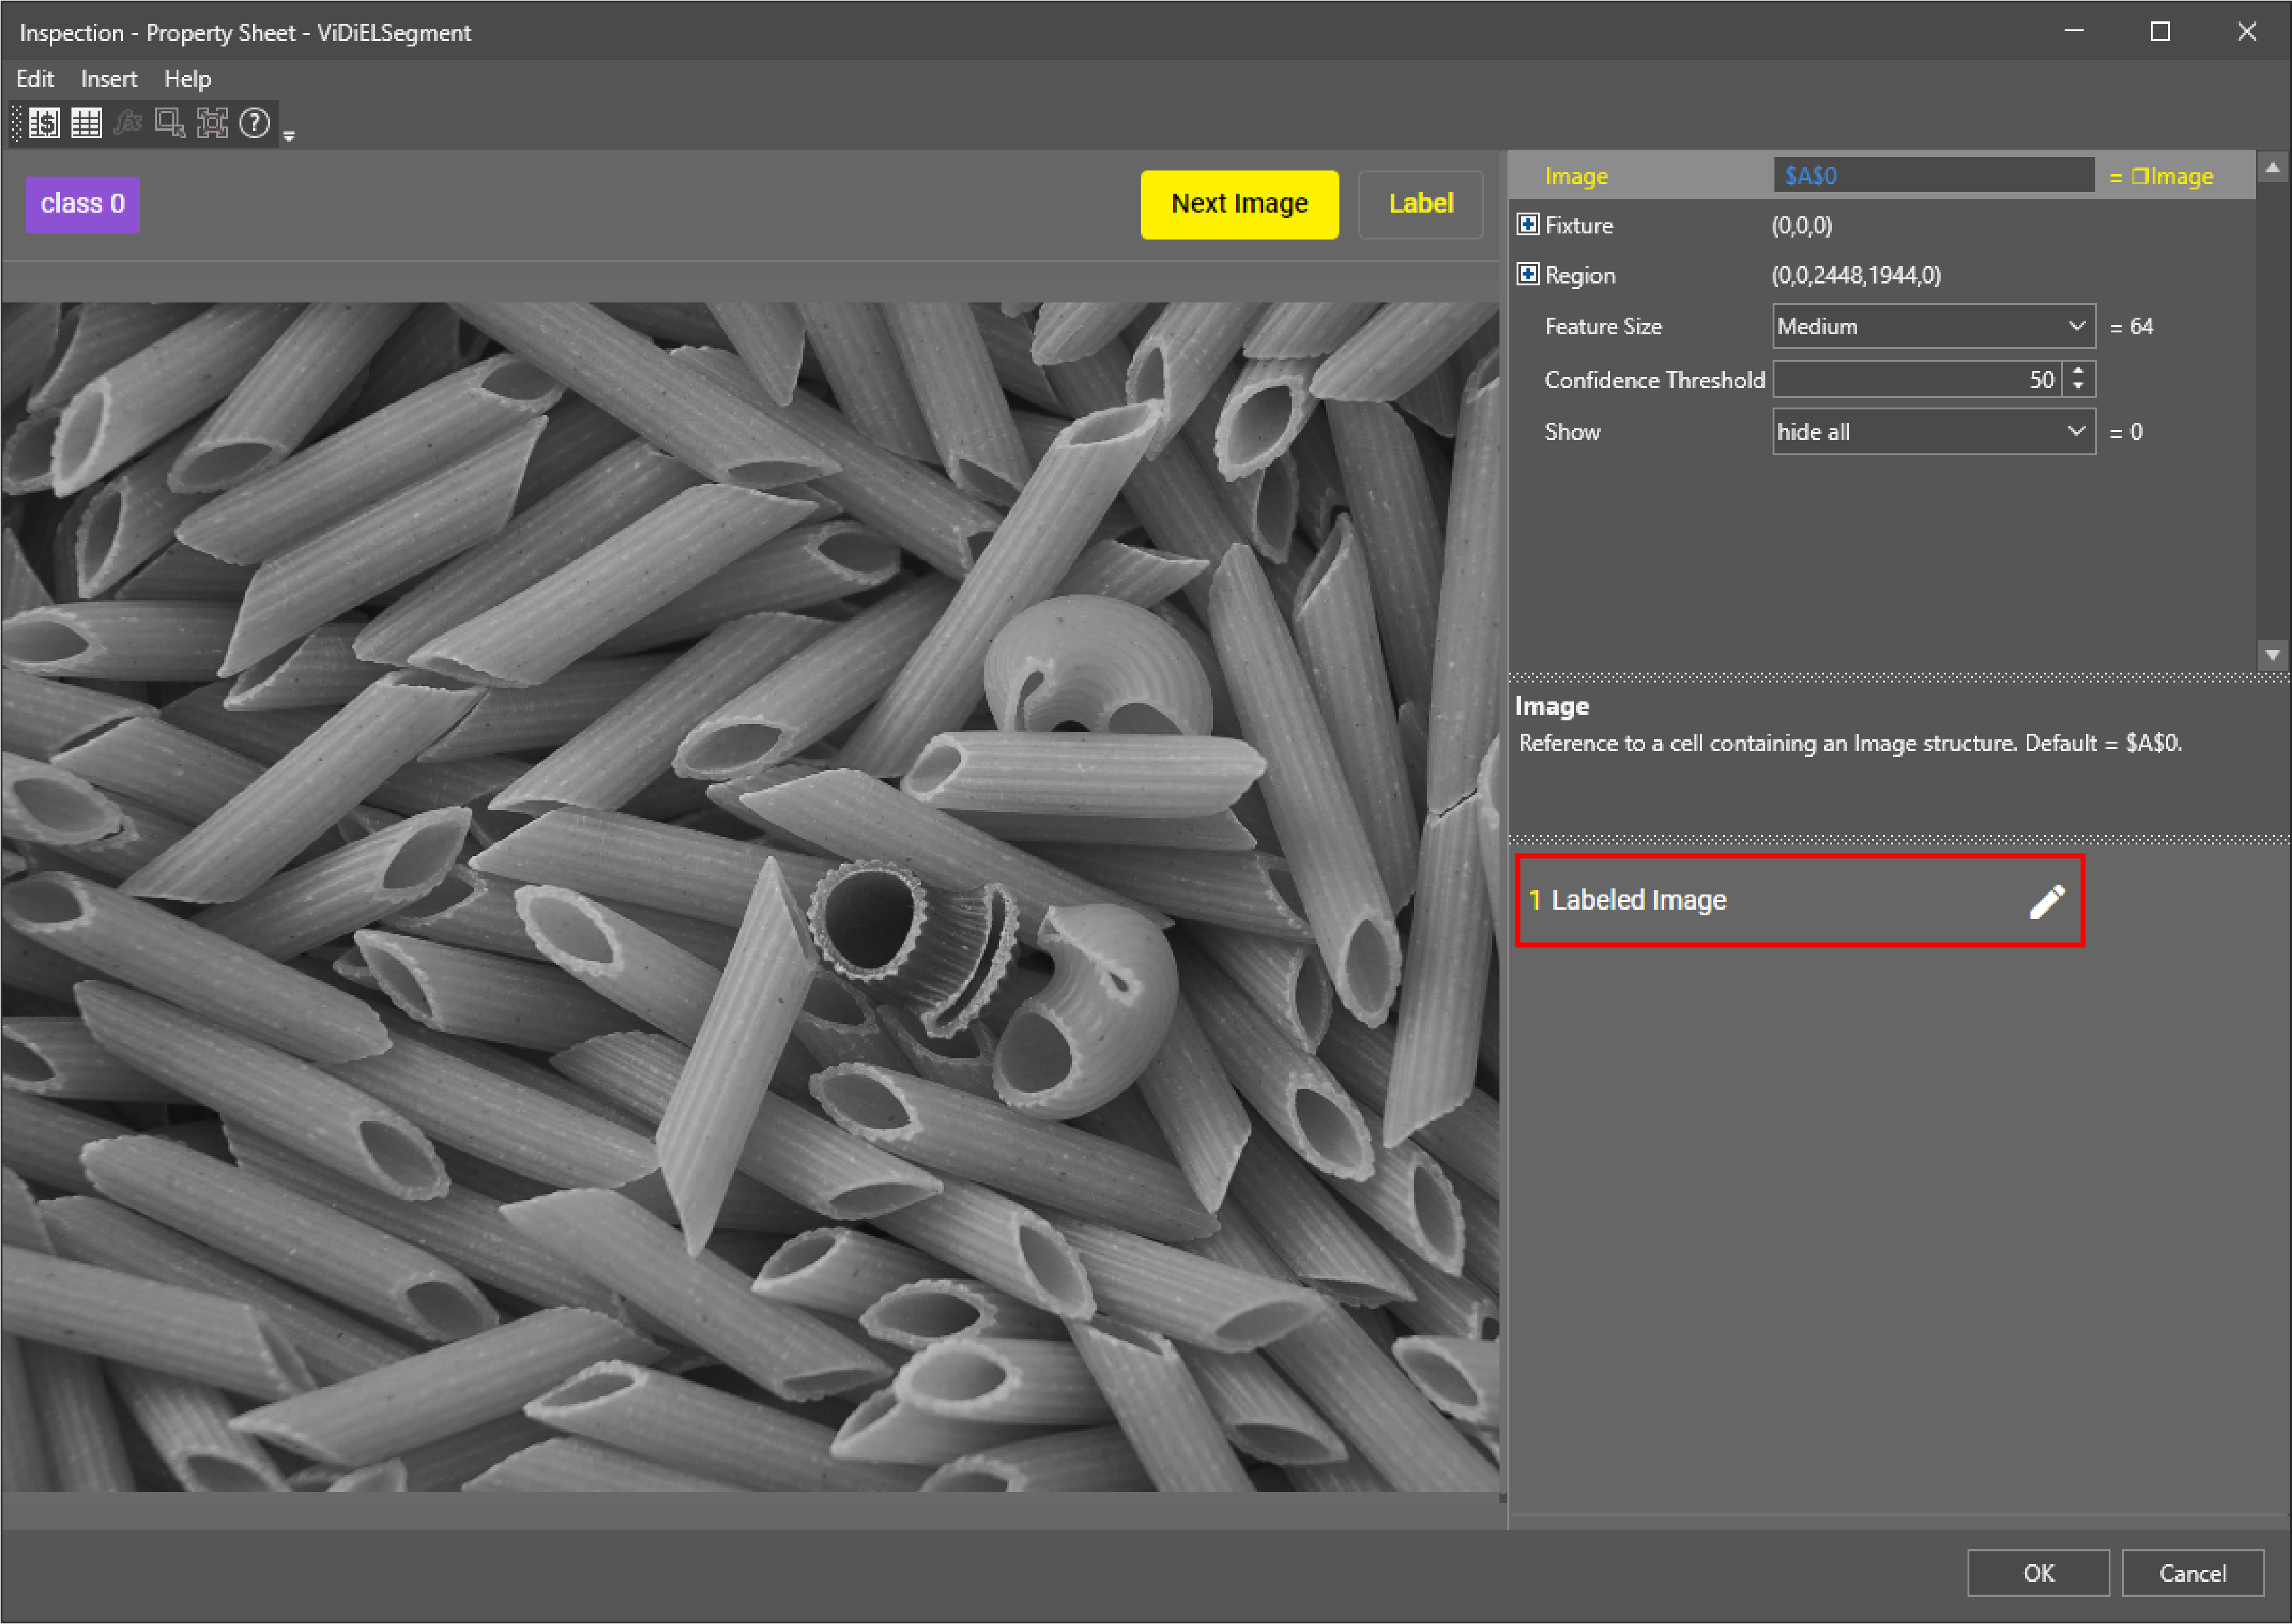
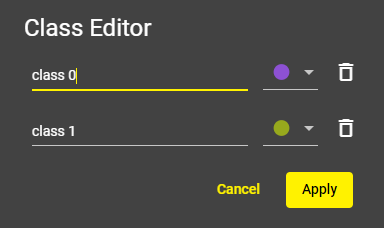
In the sample viewer, you can correct and finetune the trained images by clicking on the Edit button. You can also delete them by clicking on the Delete button, or you can edit the classes.
Click on the Edit Classes button to open the class editor where you can rename and delete classes, or change the class color:
-
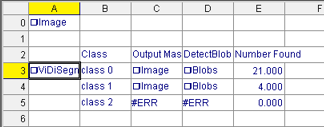
Click OK, if you finished labeling. The output of the function appears on the Spreadsheet.
|
|
|---|---|
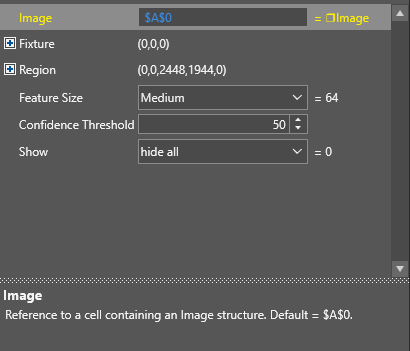
| Setting | Description |
| Image | Reference to a cell containing an image structure. Default value: |
| Fixture | Fixture origin (X, Y, Theta). Offsets from the image origin. |
| Region | Region of interest (X, Y, Width, Height, Angle). |
| Feature Size |
Relative feature size. The default setting is Medium(32). You can choose from the following sizes:
|
| Confidence Threshold | Specifies the minimum required confidence percentage when determining which pixel is assigned to which class. |
| Show | Select the type of graphic to overlay on the image. |
|
|
|
|---|---|
| Output | Description |
| Class | The names of the classes you gave. |
| Output Mask | Image data structure. |
| DetectBlob | Blob data structure. |
| Number Found | The number of the found blobs. |