RTM Lean
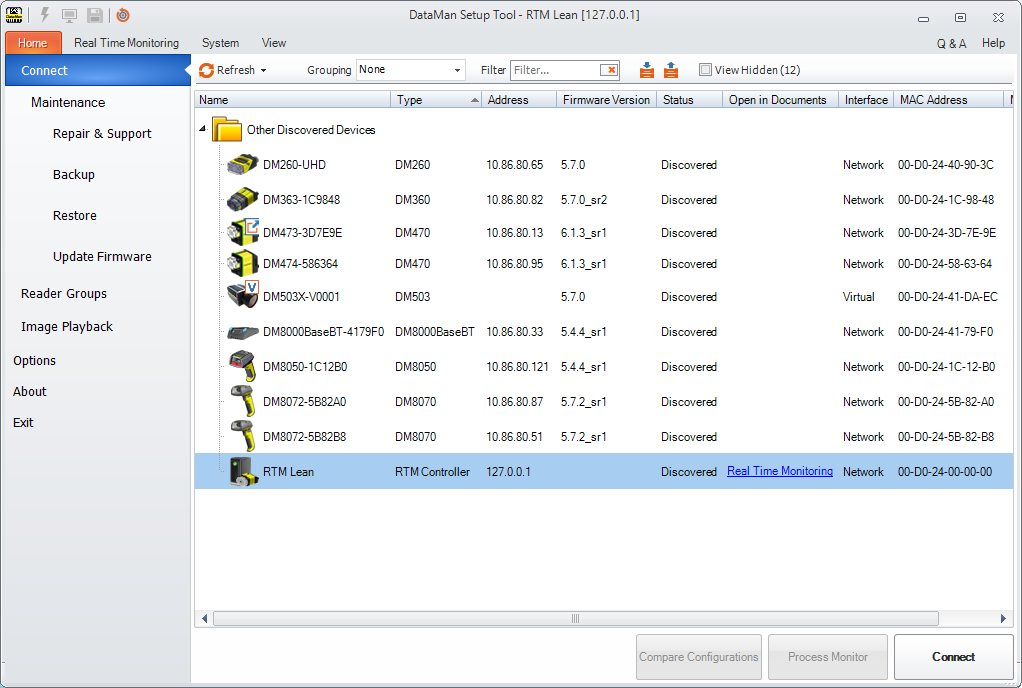
Real Time Monitoring (RTM) Lean is a feature built into the DataMan Setup Tool that allows for the collection and analysis of different kinds of data. RTM Lean collects data of devices on the network and displays this data in graphs. Connect to RTM Lean as a regular device on the Connect page.
- Connect to RTM Lean and select the device(s) you want to monitor.
- Set your options in the Settings tab and/or the Diagnostics tab and click Apply.
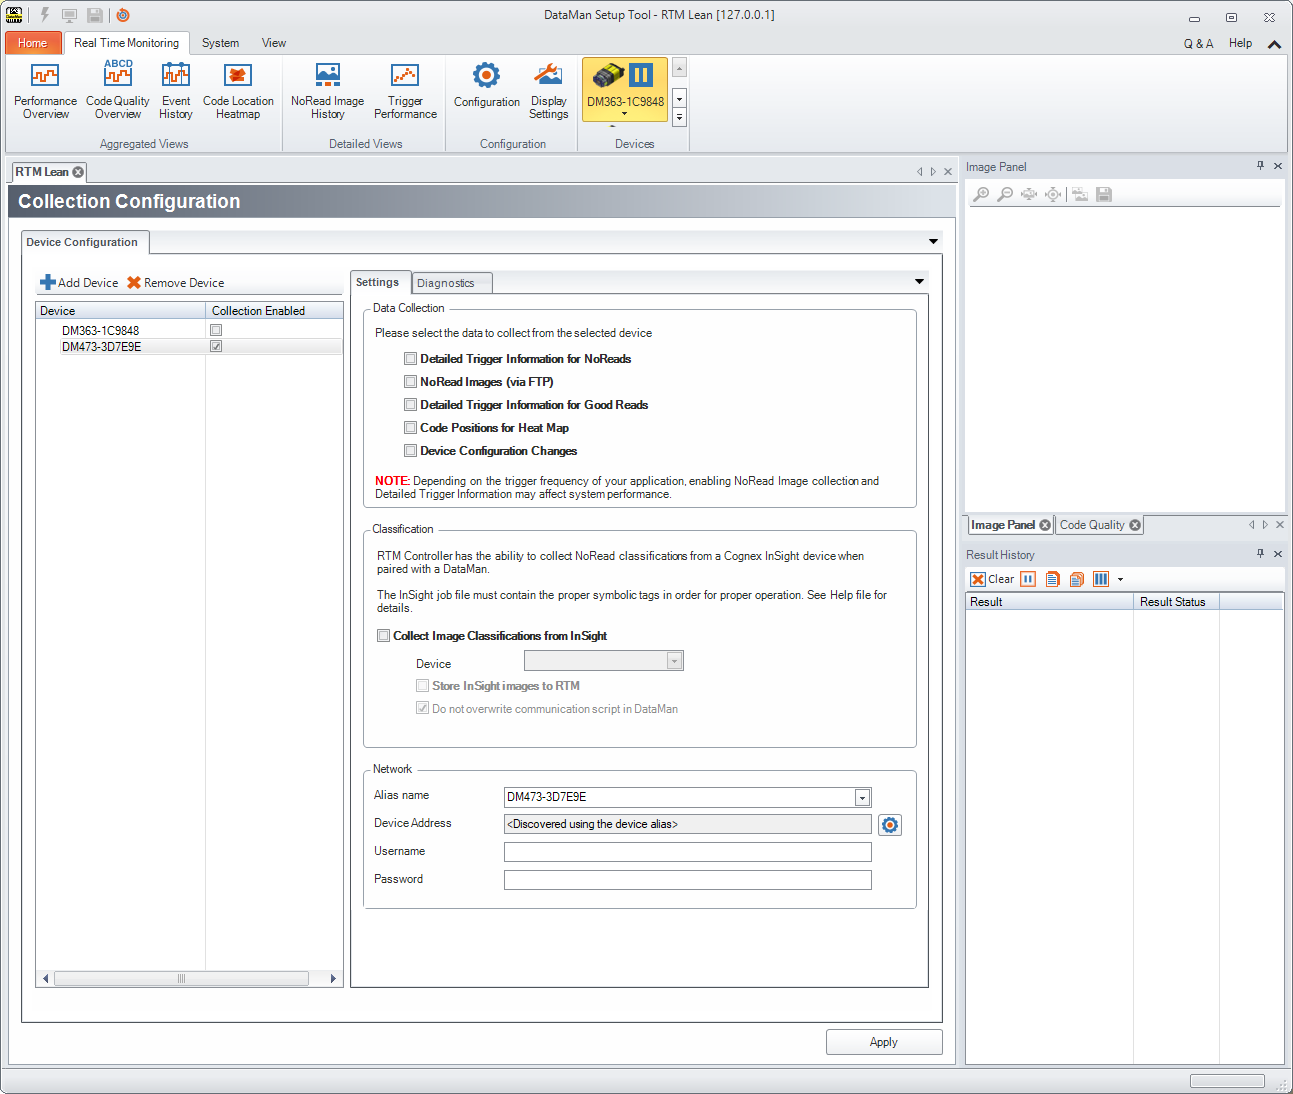
The target device for data acquisition, as well as the selection of the type of data collected, can be set up under Configuration in the upper toolbar. By default, RTM Lean collects statistical data: Read Rate, NoRead count, average decode time, trigger count, trigger overrun, buffer overflow, and process control metrics, if enabled on the device.
For a more detailed description of RTM Lean capabilities and options, see the Q & A of the page that can be opened from the top right corner.