Process Monitor
As it operates, a DataMan device logs statistics such as the number of triggers received, the number of symbols read (and not read), and the number of trigger overruns.
You can choose to have a separate Process Monitor document for each device, or you can have a single Process Monitor document for every device you want to monitor. If you want to have one Process Monitor document for each of your devices, select your device and then click the Process Monitor button and repeat this process for every device. If you want to monitor all of your devices on a single Process Monitor page, click the arrow on the Process Monitor button and click the Add to Process Monitor option that pops up.
If the Process Monitor button is disabled, it is because the device you selected does not support process monitoring or the device is open in this or another Setup Tool connection. After you connected to the Setup Tool, a DataMan device stops generating statistics about decode attempts by default. To re-enable process statistics when connected to the Setup Tool, you must manually start the Process Monitor. In the upper toolbar, click Actions, then click Switch to Process Monitor.
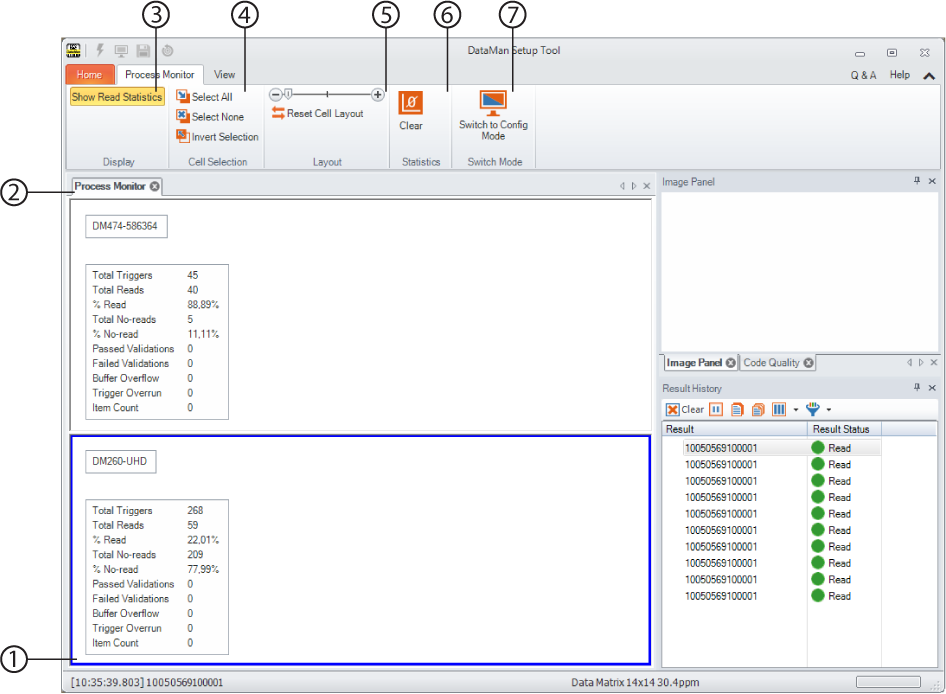
| 1 | Statistical data of one of the monitored devices. Each device gets its own window (in this example). |
| 2 | Process Monitor tab. Here only one tab is shown, but you can have multiple tabs. |
| 3 | Show Read Statistics: you can turn displaying statistical data on and off. |
| 4 | Cell Selection group: you can select multiple readers before doing mass actions. |
| 5 | Layout: reset the cell layout. |
| 6 | Clear Statistics: clear the read statistics in the selected panels any time during runtime. |
| 7 | Switch to Config Mode: switches to configuration mode |