Review Markings
Once the tool is trained, it can process images in the database, as well as newly acquired images, and place Markings on the features it finds. Markings are the VisionPro Deep Learning-generated outputs which are used to graphically display the neural network model's interpretation, along with generating the statistical results. They are the graphical elements that the tools place over characters, features and/or areas of the image that the tool identified, based on the Labeling done prior to being trained. For the Red Analyze Tool, the Marking consists of an anomaly score, and a heat map (aka deviation map) and polygon regions that outline defects and/or anomalies.
You can toggle the display of labels and markings by either using the Alt + Left arrow and Alt + Right arrow keys, or from the right-click menu in the image.
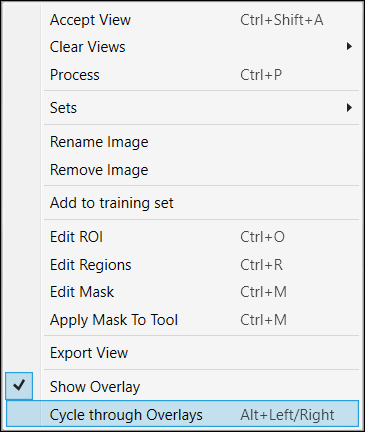
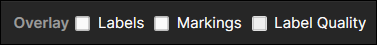
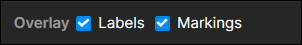
You can also show overlay with enabling the "Markings" at the Overlay Checkbox.
Markings and Results
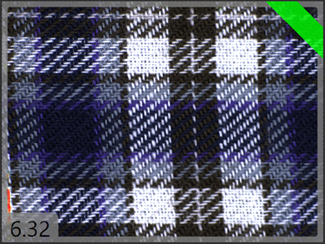
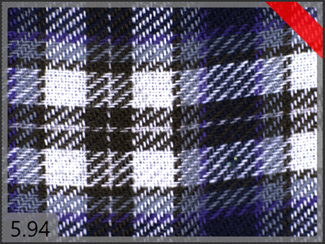
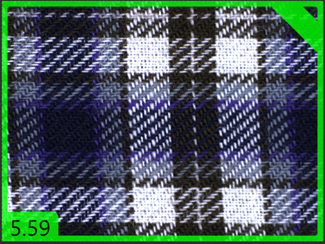
While in Unsupervised Mode, a border around the image indicates the classification of the image, as follows:
- Green = Good
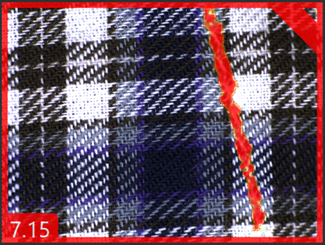
- Red = Bad
- Grey = Unable to discern
When a grey border is present, the score will be in between the Good and Badscore thresholds. In addition, the score each image receives will be displayed in the bottom left-corner of the image.
When an image contains a possible error, a heat map of the error will be drawn on the image, as shown in the bottom right image.
|
|
|
|
|
|
Overlay Checkbox
The 2 tables above are shown back and forth or side by side, with the overlay graphics of labels and markings, whenever you press Alt + Left/Right (Keyboard Shortcuts When Working with an Image) or enable each checkbox (Labels and Markings) on Overlay Checkbox
Region List
The region list is the table displayed on the bottom of Image Display Area that shows the information of each defect region. It consists of 2 tables, each holds the information for the labeled defect region (the defect region you labeled for training) and the marked defect region (the predicted defect region as the result of processing). Each row in a table represents the information of each defect region.
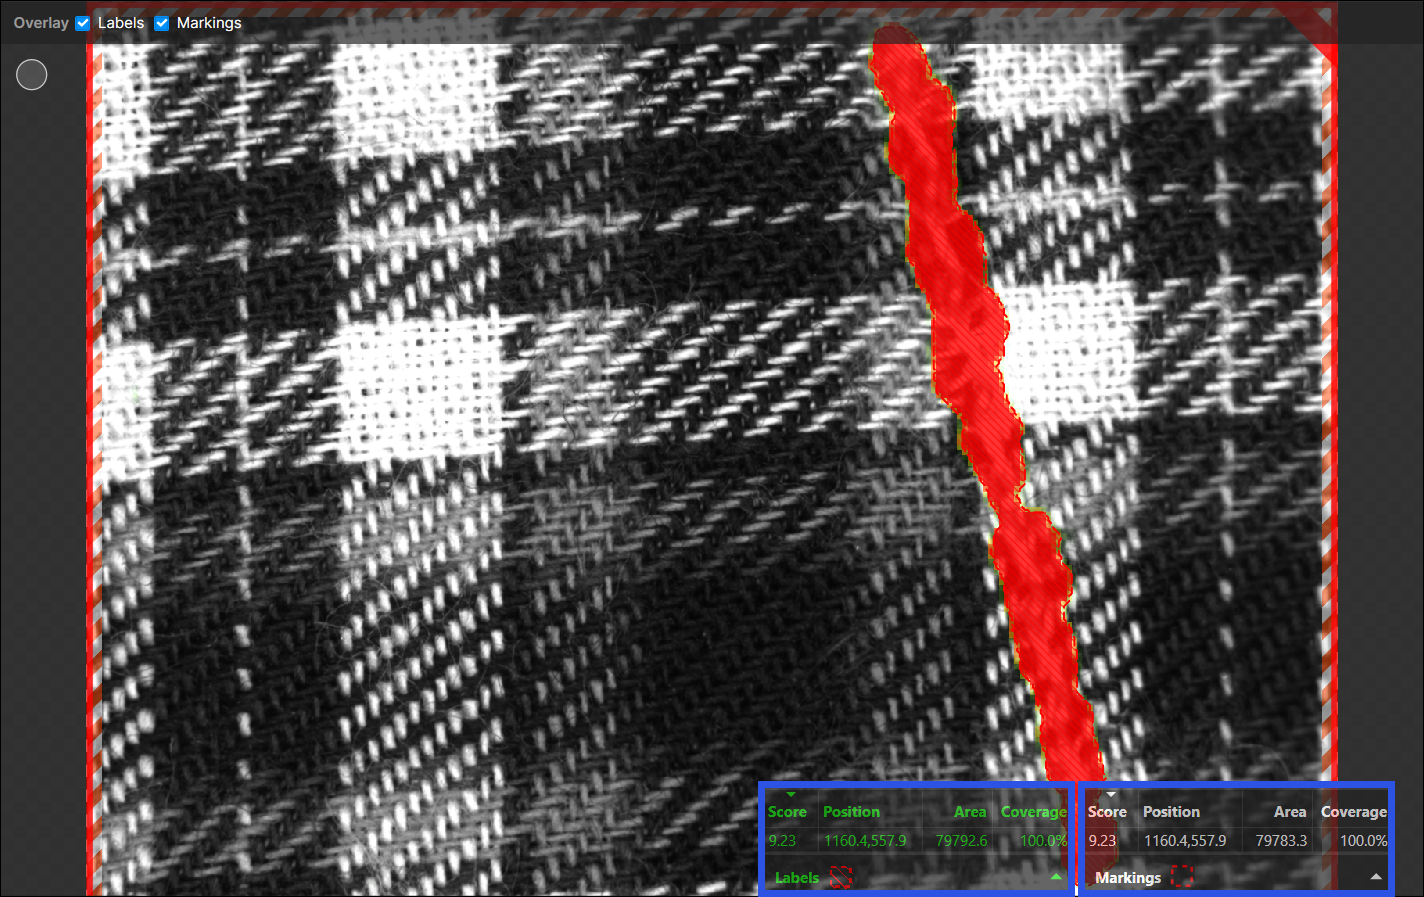
For each table, you can click a row to highlight its information both in the table and Image Display Area.
| Column | Description |
|---|---|
|
Score |
The highest defect probability among the defect probabilities of each pixel in the defect region, as the result of processing. For the Labels table, this represents the highest defect probability for a region that was labeled as a defect region. For the Markings table, this represents the highest defect probability for a region that was predicted as a defect region. |
|
Position |
The x, y coordinate of the center of the defect region. |
| Area | The number of pixels in the defect region. |
|
Coverage |
The overlapping ratio between the labeled defect region and the predicted (marked) defect region. |