Manual Mode Workflow
To find the best combination of tool parameters for your specific VisionPro Deep Learning tool, you starts with launching Parameter Search Utility and load the workspace, stream, and tool.
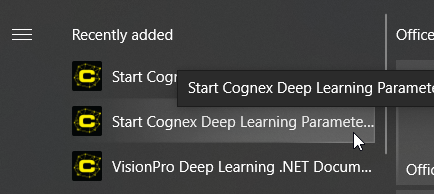
Launch Parameter Search
Launch Parameter Search independently from VisionPro Deep Learning.
-
Windows Startup Menu
-
C:\Program Files\Cognex\VisionPro Deep Learning\3.2.1\Parameter Search\
Before launching Parameter Search, you need to make sure that your VisionPro Deep Learning workspace is ready for the search. All the images in your workspace must be labeled, the workspace must have a training set with enough images, and the mode and the architecture of the tools in the workspace must be chosen, before you import this workspace into Parameter Search.
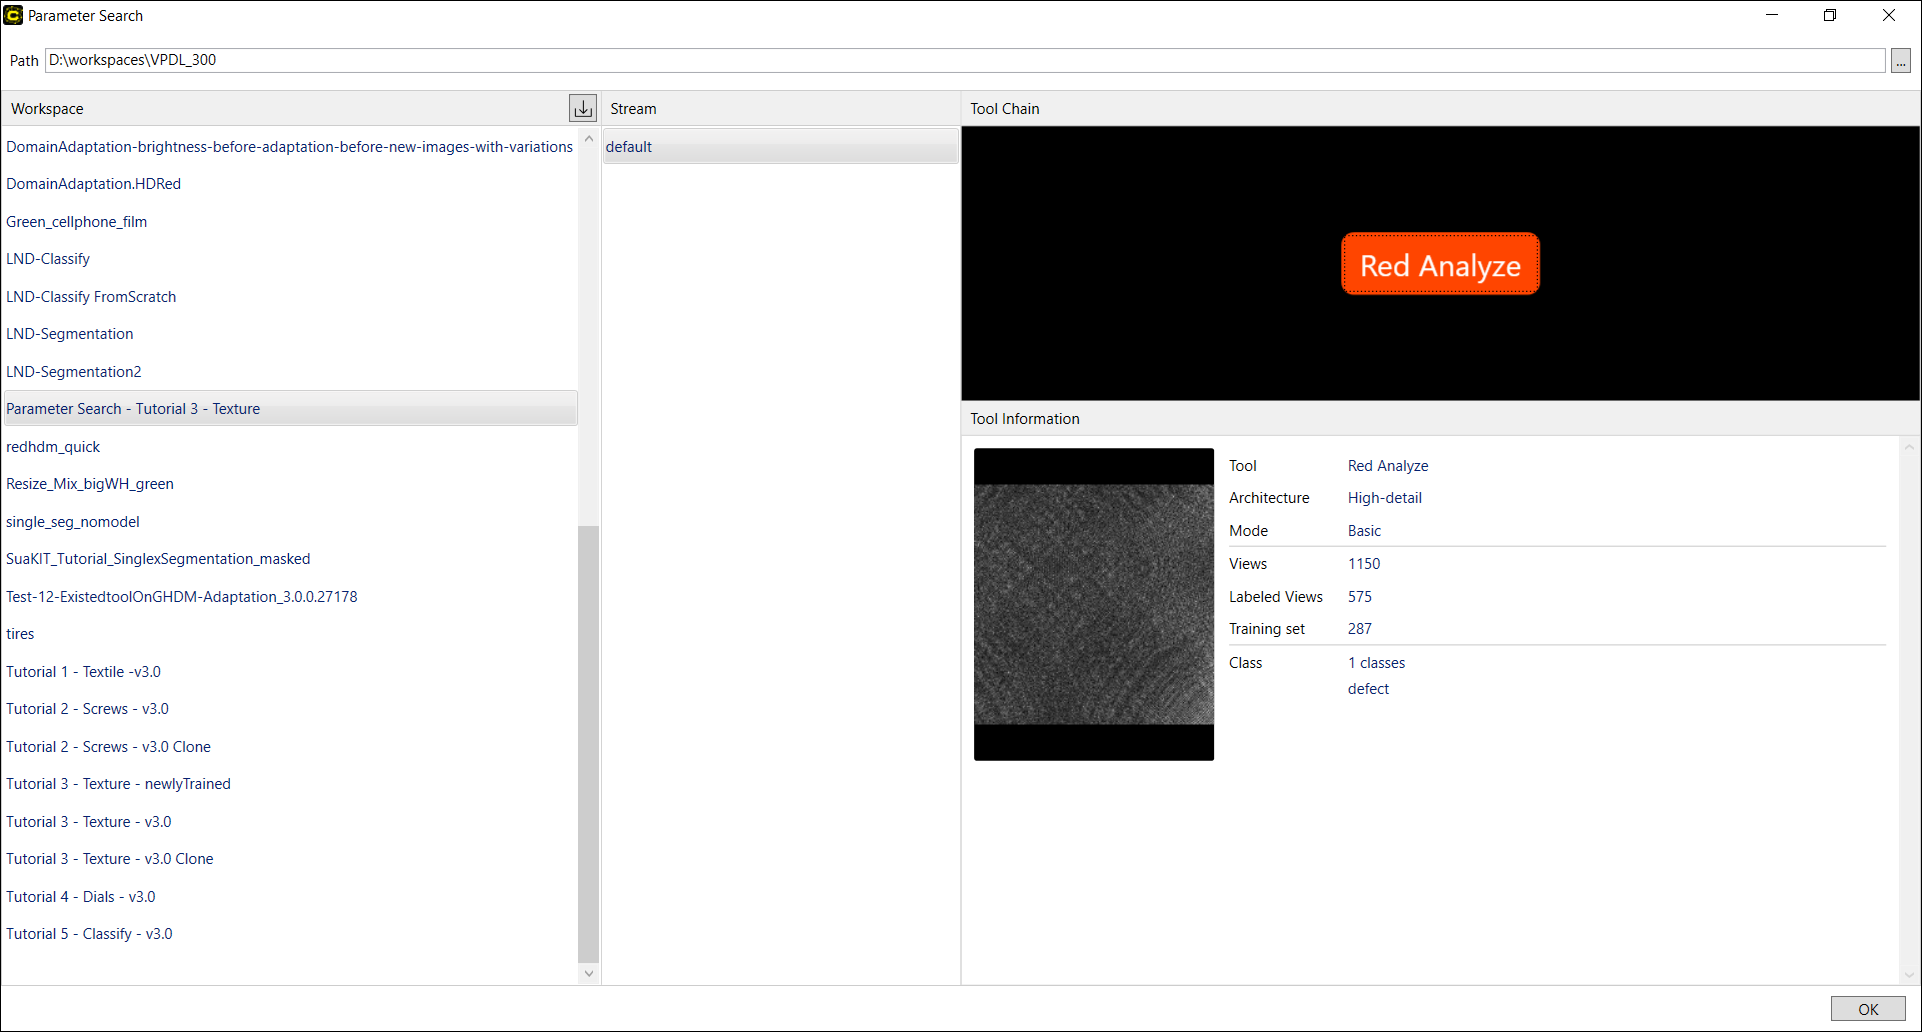
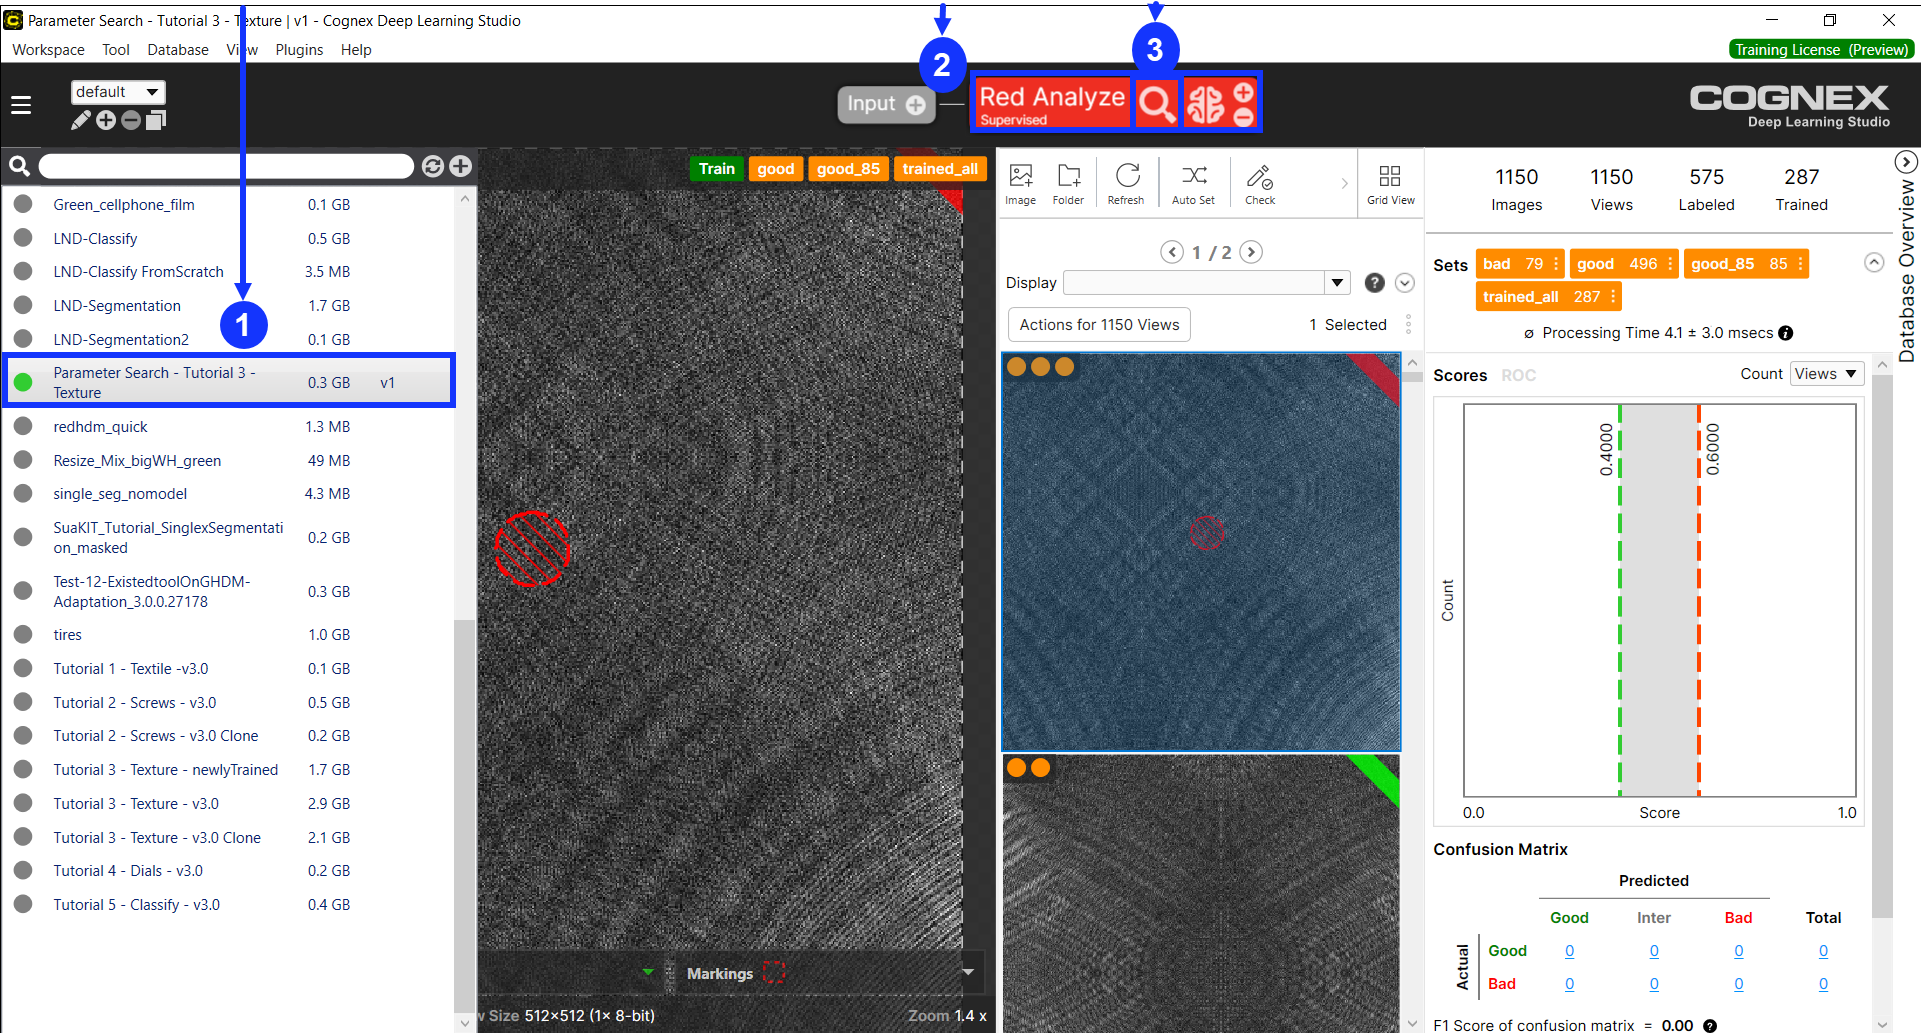
Once you launched the Parameter Search utility, you enter the Home screen shown below. On this screen, you can import the workspace, stream, and the tool to be tested against many parameter sets.
Load Workspace, Stream, Tool
Please follow the steps below to load the workspace, the stream, and the tool whose tool parameter values are to be searched over.
-
On the right side of Path bar, click
 button and set the path to the directory that contains your workspaces, you will use for searching.
 -
Once the path to the workspaces is set, all the workspaces exist under that path will be loaded on Workspace pane. Choose the specific workspace you will use on the pane. A loaded workspace contains all of the configured streams and tools in it.
-
If you want to add a workspace from another path to the current path, you can directly import a workspace from another directory with
 button. The imported workspace must be of VisionPro Deep Learning Workspace Archive file (.vwsa) format, which is created when you export a workspace from VisionPro Deep Learning. On Upload Workspace dialog, you can select this VisionPro Deep Learning Workspace Archive file to import this workspace into the current path. The imported workspace will be on Workspace pane and also copied and placed under the physical directory of the current path.
-
-
Choose the stream you will use on the Stream pane.
-
Choose the tool you will use on the Tool Chain pane. Once you select the tool its details will be shown on the Tool Information pane. As Adaptation mode is not supported in Parameter Search, you cannot select a tool with Adaptation mode.
-
After confirming the tool information, click OK to move on to setting up which parameters would be tested for this tool.
Select Manual Mode
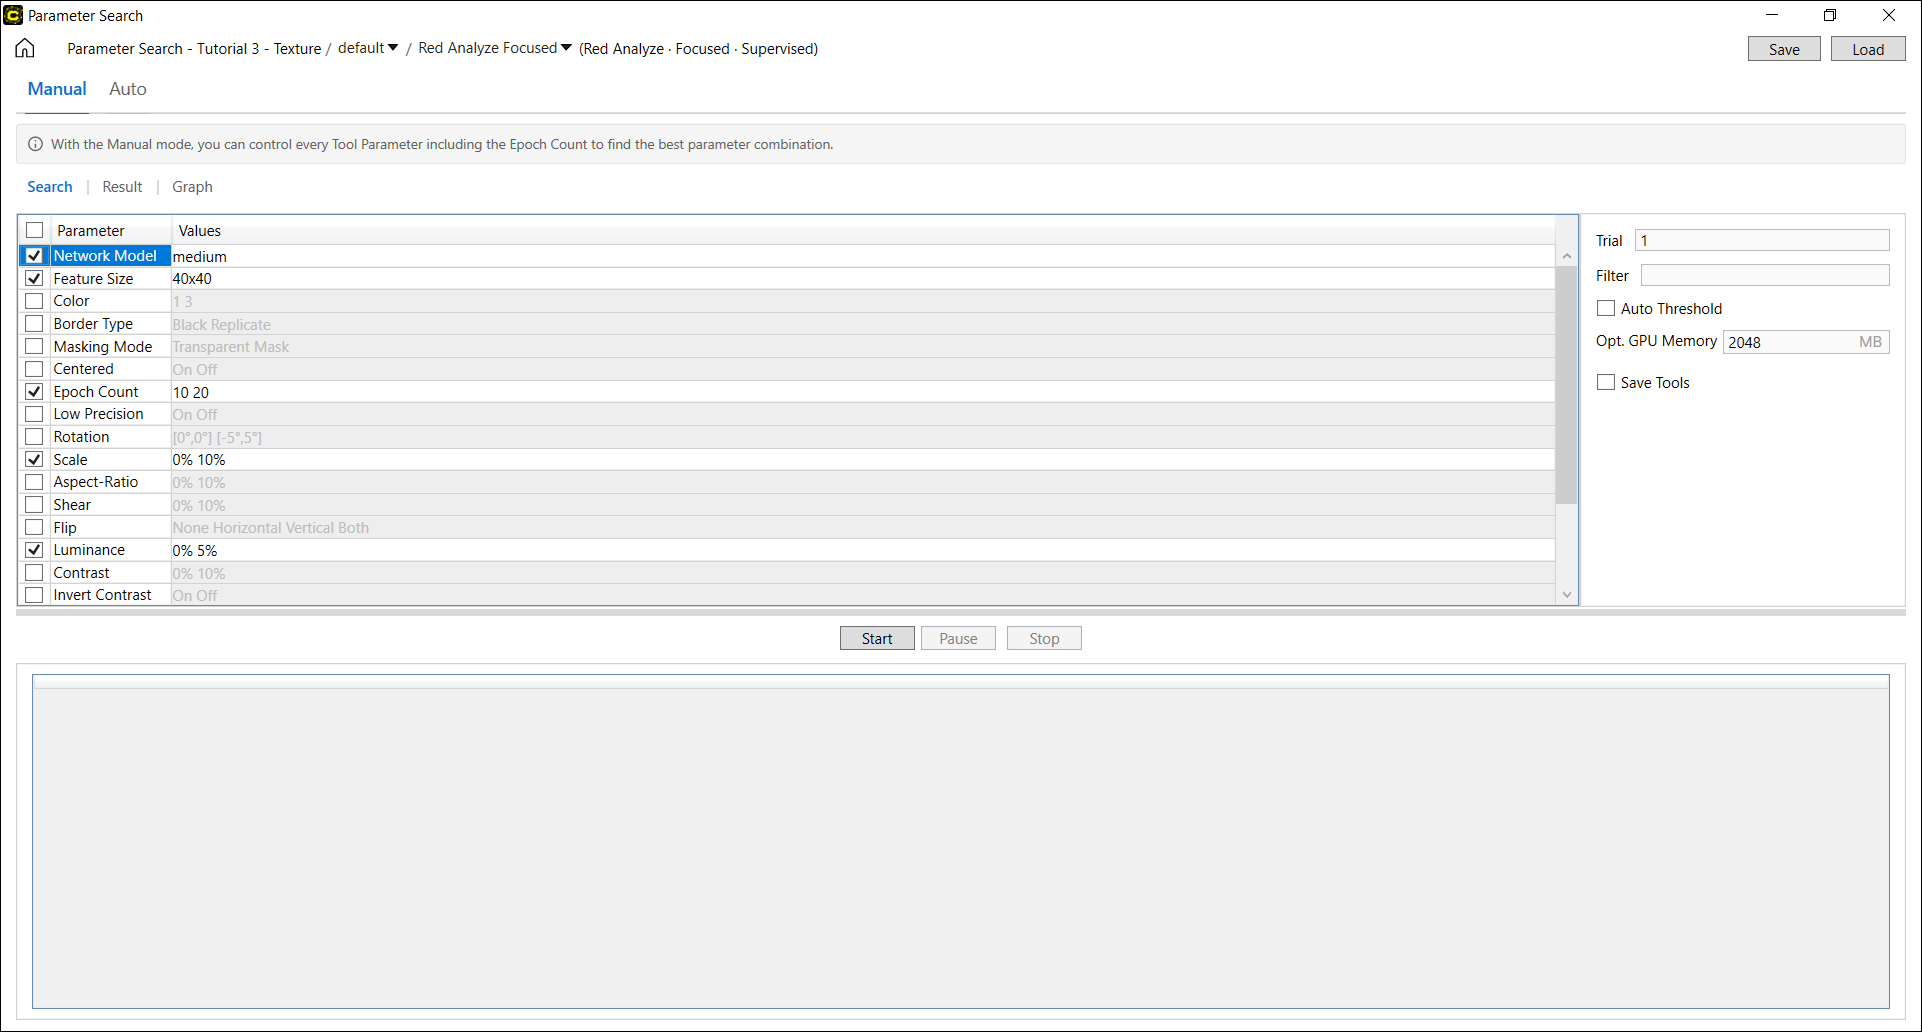
After the desired workspace, stream, and tool is loaded, you need to select search mode. Go to the navigation tab and click Manual. The manual mode runs tests over every combination of the selected parameter values, and returns all results.
Setup Parameters
Once the search mode is selected, you need to select a set of parameters and their value ranges to be tested. See Parameter List for more details of supported Tool Parameters in Parameter Search.
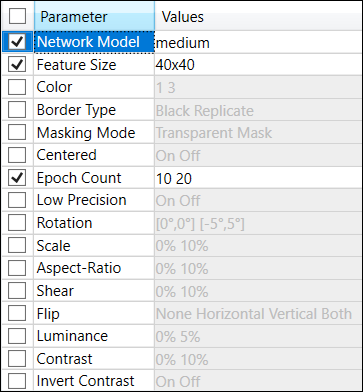
If you activated the manual mode, the following parameters are selected as default. You can modify the values of these parameters, or remove them or add other parameters to be searched.
-
Focused tools (Red Analyze, Green Classify, Blue Locate, Blue Read)
-
Network Model, Epoch Count, Feature Size
-
-
Red Analyze High Detail
-
Network Model, Epoch Count, Patch Size, Vertical Flip, Horizontal Flip, Rotation 90
-
-
Green Classify High Detail
-
Network Model, Epoch Count, Vertical Flip, Horizontal Flip, Rotation 90
-
-
Green Classify High Detail Quick
-
Epoch Count
-
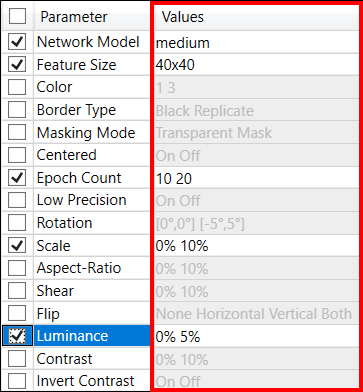
Choose Parameters
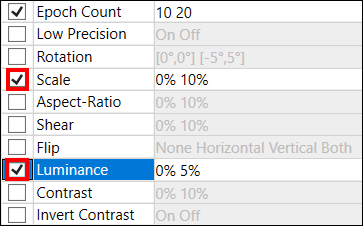
On the Search page, select the parameters over which you want to run the search by enabling checkboxes  . You can add 1 or more parameters that are to be tested.
If you have a previously saved Parameter Search Data XML file which contains a set of parameters and their values to be searched, click Load to load it on the Search page.
Assign Value Range
In the Values column, type in the range of values for the selected parameters. Click each cell in Values column to modify the values for a parameter. Mainly there are 3 ways of providing values (or value ranges) of each parameter.
- Type the specific values in the cell (Int, Double)
- To add multiple values for a specific parameter, use a blank(Space key) as the separator between each value.
- Enable checkboxes in the cell (Enum, Boolean, String)
- For the values of some parameters (eg: Network Model), enable checkboxes to select the values to be tested in the search.
- For the values of some parameters (eg: Network Model), enable checkboxes
- Fill in the cell by the input form (Size, Interval, String, Dictionary)
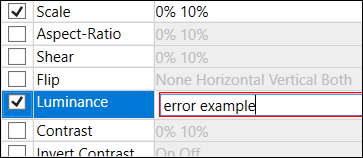
Click the check button  if you finished editing a cell and want to fix the value range(s) for a parameter. If you want to modify inserted values for a parameter, click the cell again you want to modify. After entering a value if the cell is outlined in red, there is an error in the value input syntax.
Set Options
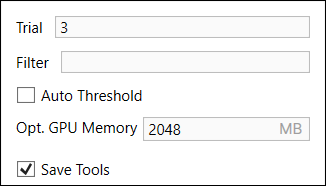
Set the search options if necessary.
| Option | Description |
| Trial | Set the number of trials for this search. Note that multiple iterations will provide more statistical analysis, such as the mean, median and standard deviation which will be displayed in the result table on Graphs page, but will also require more time to execute. |
| Filter | Filter results (the result tables, Database Overview, the graphs) displayed on Results and Graphs page using the filter syntax. Type in a filtering phrase and press Enter. The filter syntax will be applied on result table and the graph. See Filter Grammar for the details of the filter syntax. Once a filter syntax is applied, the search results of the views which were screened out by applying the filter will not be shown as those views are not processed. You cannot change the filter syntax once the training is finished. |
| Auto-Threshold (Red Analyze) |
Enable Auto-Threshold to automatically set the Threshold values (T1 and T2 values) to optimize the results in the Result page. See Configure Processing Parameters for more details. |
| Optimized GPU Memory | Enable optimized GPU memory by feeding the amount of memory to be used. You can enable the optimized GPU memory for efficiency if your tool is a Focused mode tool. When your tool is a High Detail or High Detail Quick tool, optimized GPU memory will be automatically disabled for faster performance. |
| Save Tools |
Save the currently loaded tool with the search results once the search is done. If you want to export the parameter configurations and the trained tools (the trained networks) trained with these configurations once the search is done, you should enable this option. The trained tools will be exported under the directory containing the Parameter Search Data XML file.
|
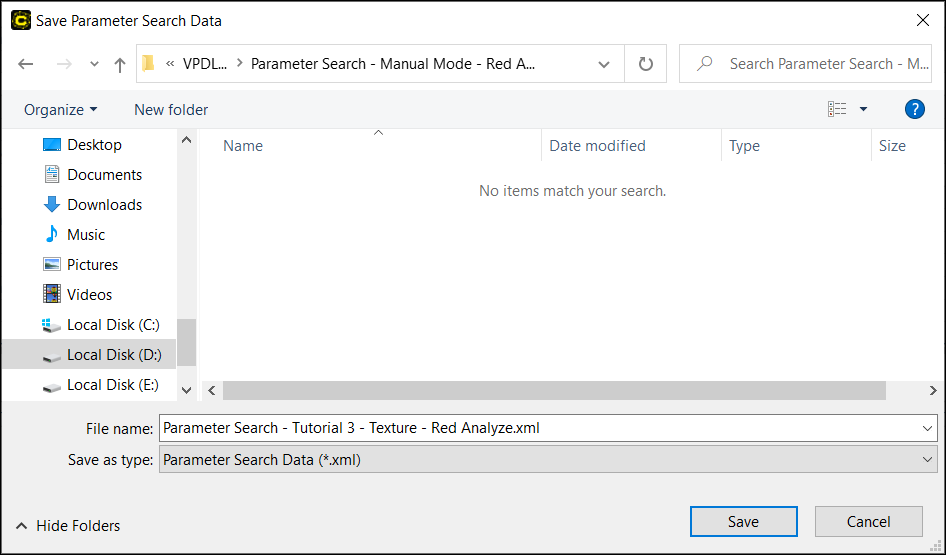
Save as Parameter Search Data XML File
Click Save to save a Parameter Search Data XML file. If you did not save a file and you press the Start, you will automatically be prompted to save a Parameter Search Data XML file. You will choose the path where a XML file will be saved. Once it is saved, the Parameter Search Data XML file will contain the parameter configurations you entered, and it will also contain the search results shown in Result and Graph page once the search is done.
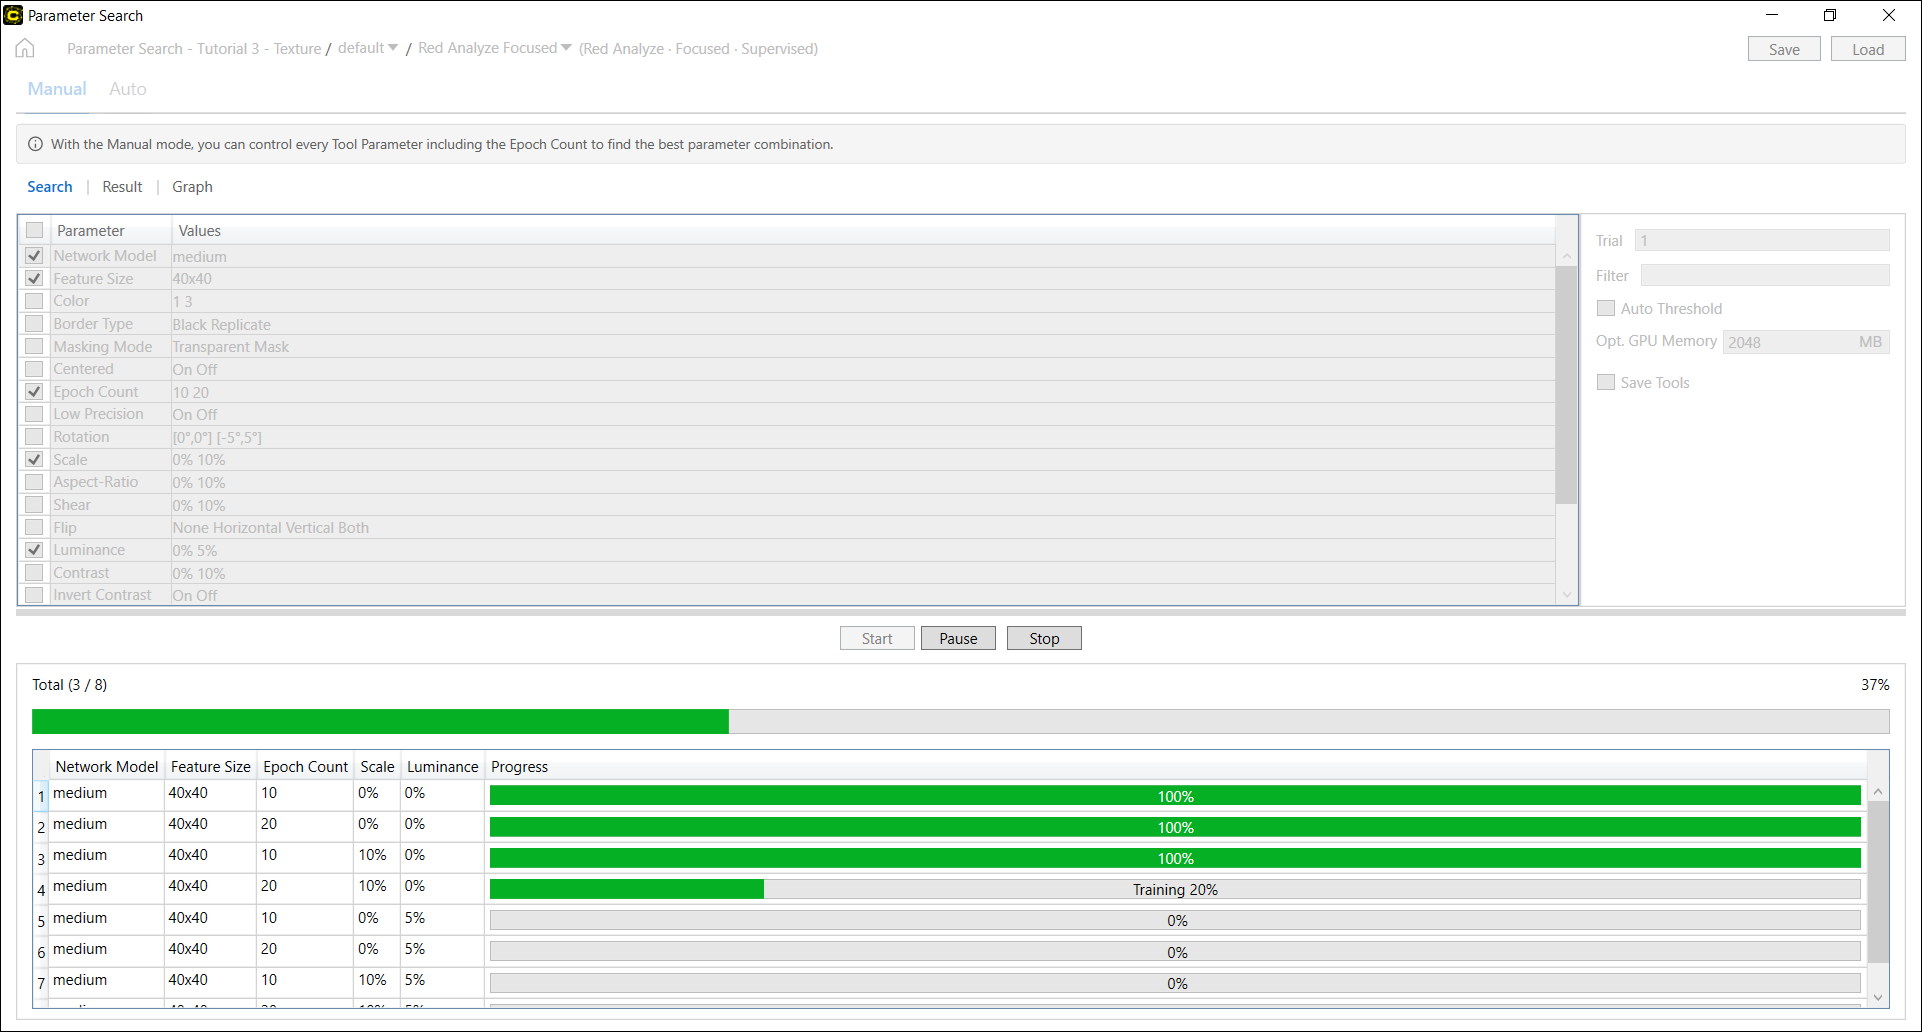
Start Search
Click Start to begin the search. The progress of the search will be displayed at the bottom of the page. Once the search begins, the utility will indicate the search progress for each parameter combination at the lower pane of the screen.
If you click Pause to temporarily halt the search and click Start again, the search will be restarted all over again from the test at the time of being paused. Once the search is completed, you can review the results to determine the best combination of parameters on the Results tab. Note that, unlike the auto mode, you can check the results of completed trials in real time without pausing or stopping the search on Results tab. You can also see the results of completed trials once you pause or stop the search.
Review Search Results
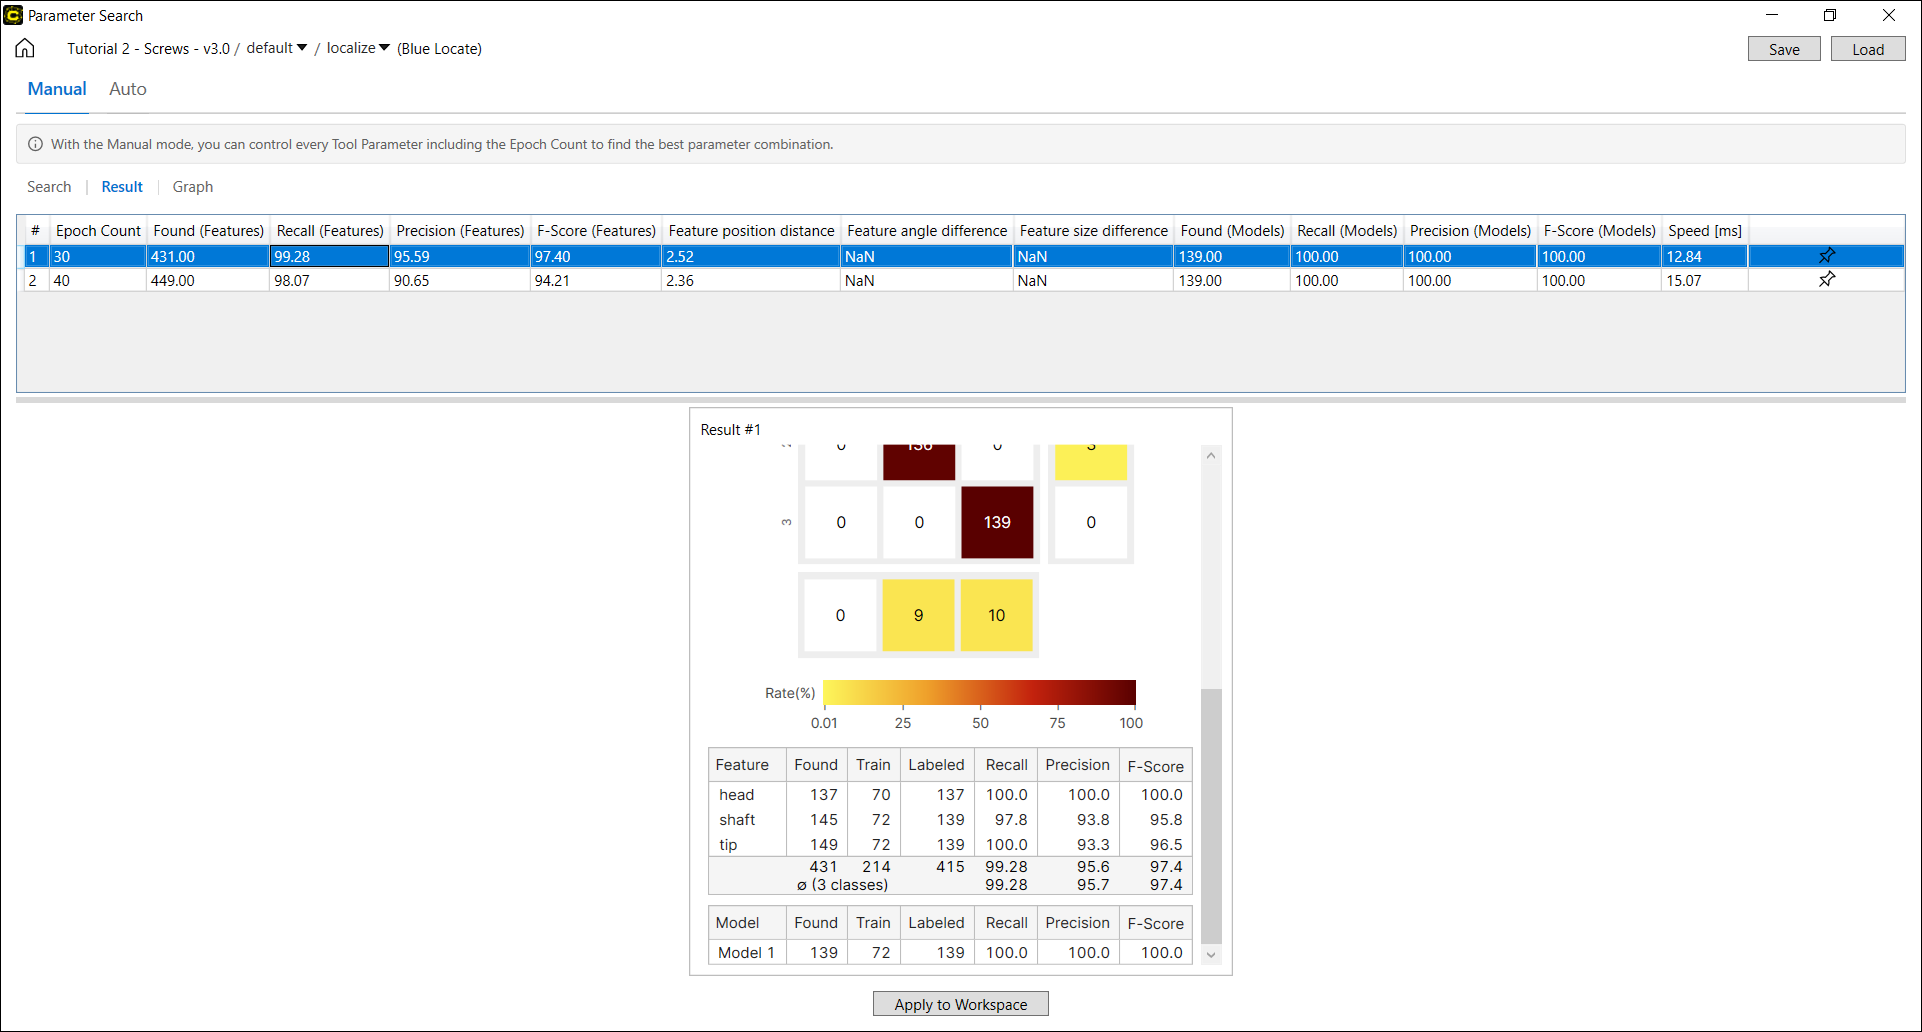
You can investigate the results of parameter search on the Results page once the search is done. The search results are displayed in the Result Table. The auto mode displays a few best results whereas the manual mode displays all the results from every parameter combination. Each row of this table describes the values of each parameter combination that were tested, and the test results (F-score, AUC, and others), which are different by tool type. For each row of this table, you can project a Database Overview that formulates the search results with a confusion matrix.
Statistics on Result Table
The result table describes the result statistics per each tool type:
| Red Analyze | Green Classify | Blue Locate and Blue Read |
|---|---|---|
|
Precision (Confusion Matrix) |
F-Score |
Found (Features) |
|
Recall (Confusion Matrix) |
F-Score (avg) |
Precision (Features) |
|
F-Score (Confusion Matrix) |
AUC |
Recall (Features) |
|
Precision (Region Area Metrics) |
Speed [ms] |
F-Score (Features) |
|
Recall (Region Area Metrics) |
Found (Models) | |
|
F-Score (Region Area Metrics) |
Precision (Models) | |
| AUC |
Recall (Models) |
|
|
Speed [ms] |
F-Score (Models) |
|
| Feature Position Distance | ||
| Feature Size Difference | ||
| Feature Angle Difference | ||
| Speed [ms] |
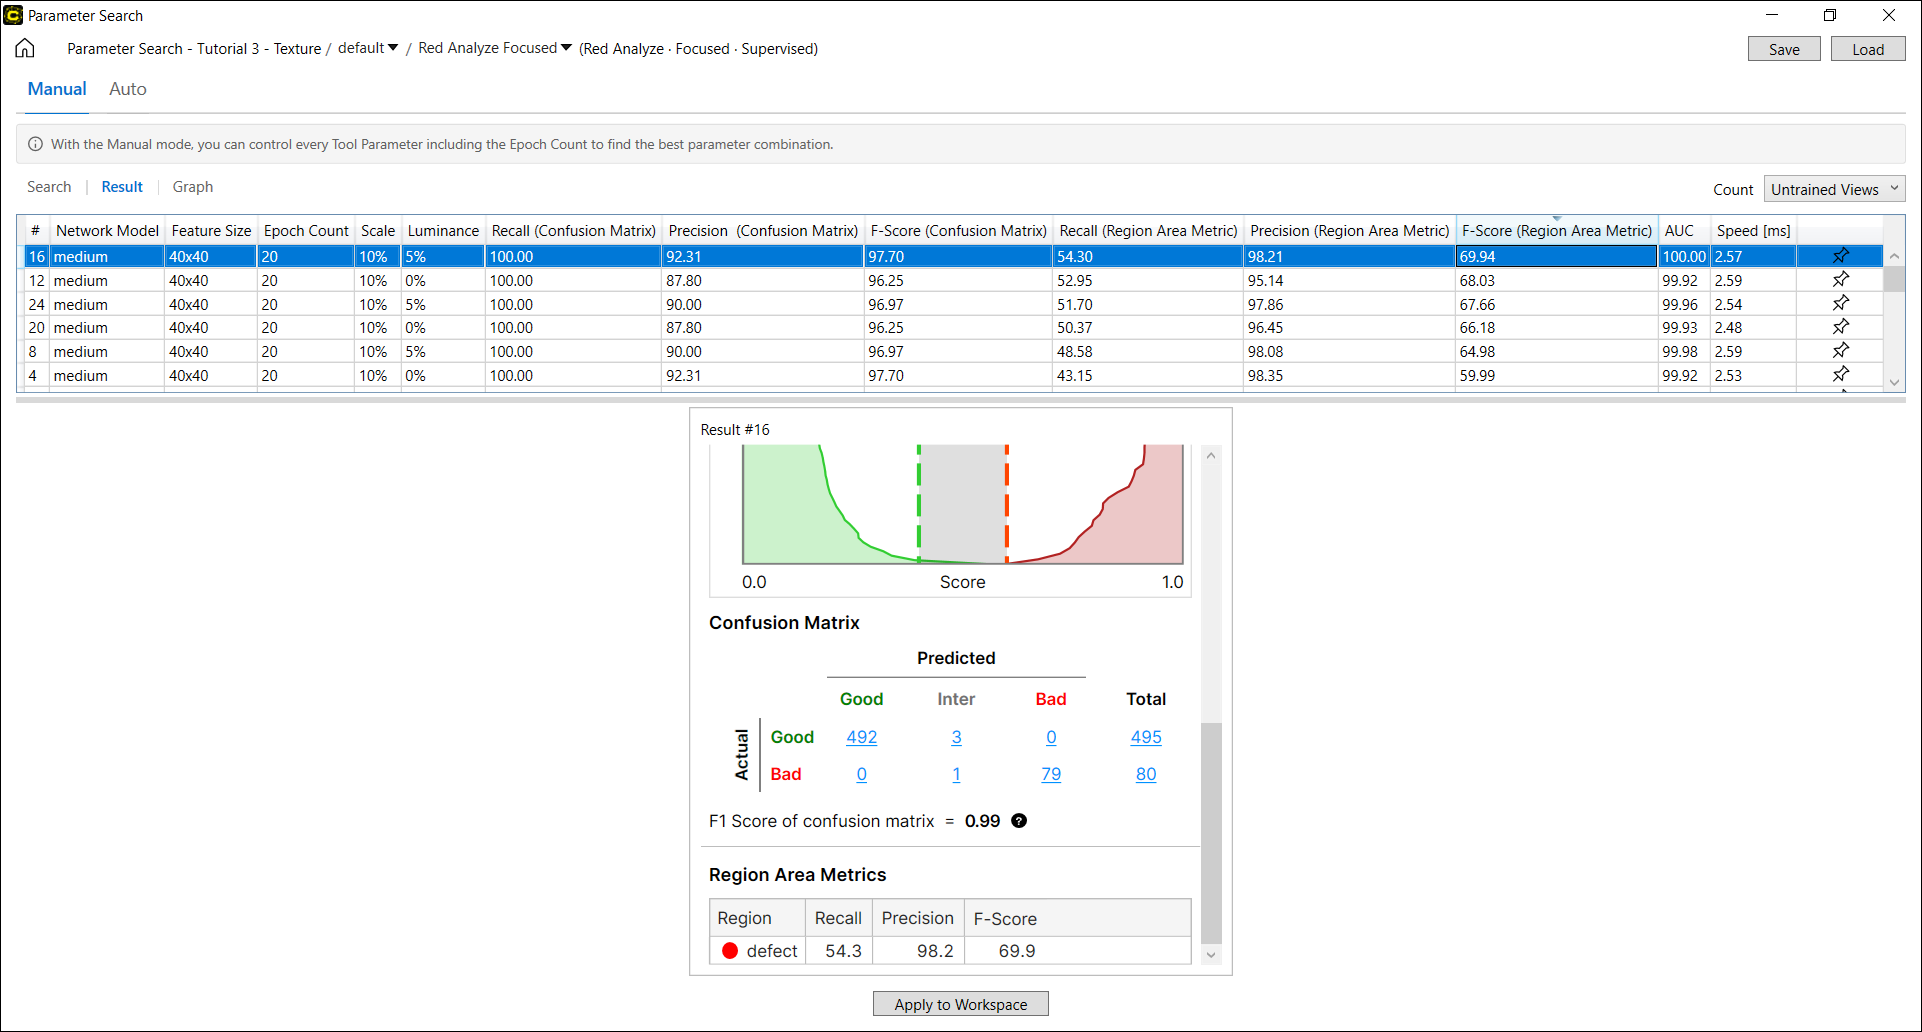
Red Analyze Results
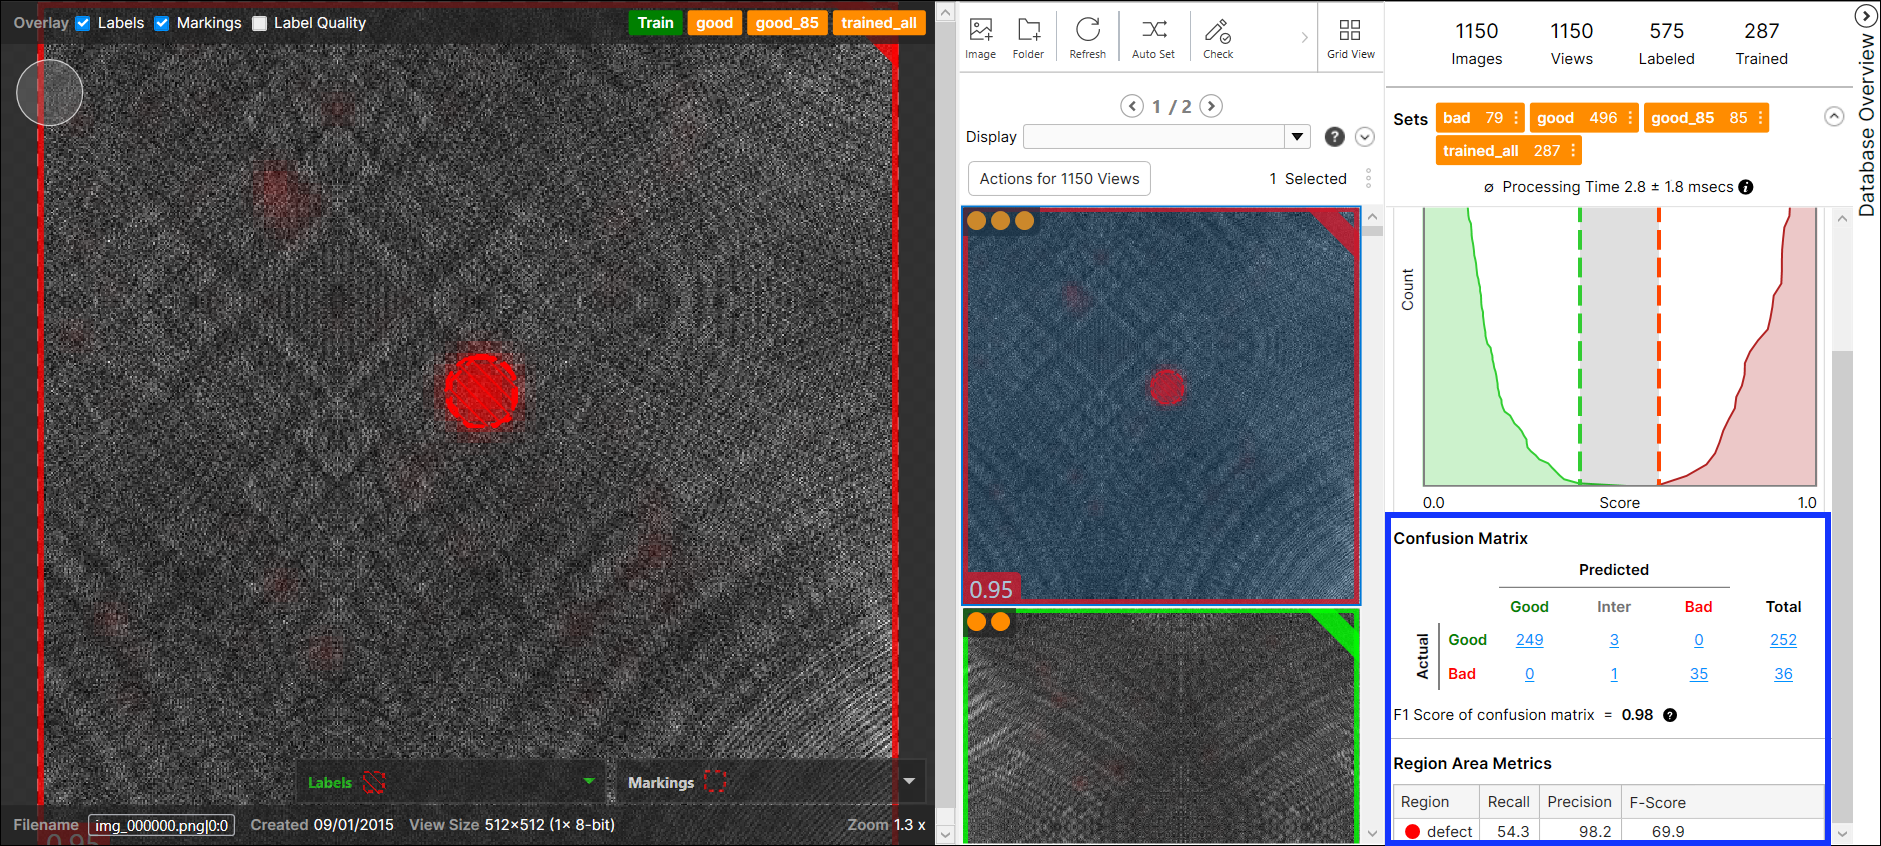
The search results of a Red Analyze tool includes Region Area Metrics (Precision, Recall, F-score calculated in pixel level, only for Red Analyze Supervised and Red Analyze High Detail) and the metrics of Confusion Matrix (Precision, Recall, F-score calculated from confusion matrix items). See Region Area Metrics and Confusion Matrix for the interpretation of the search results.

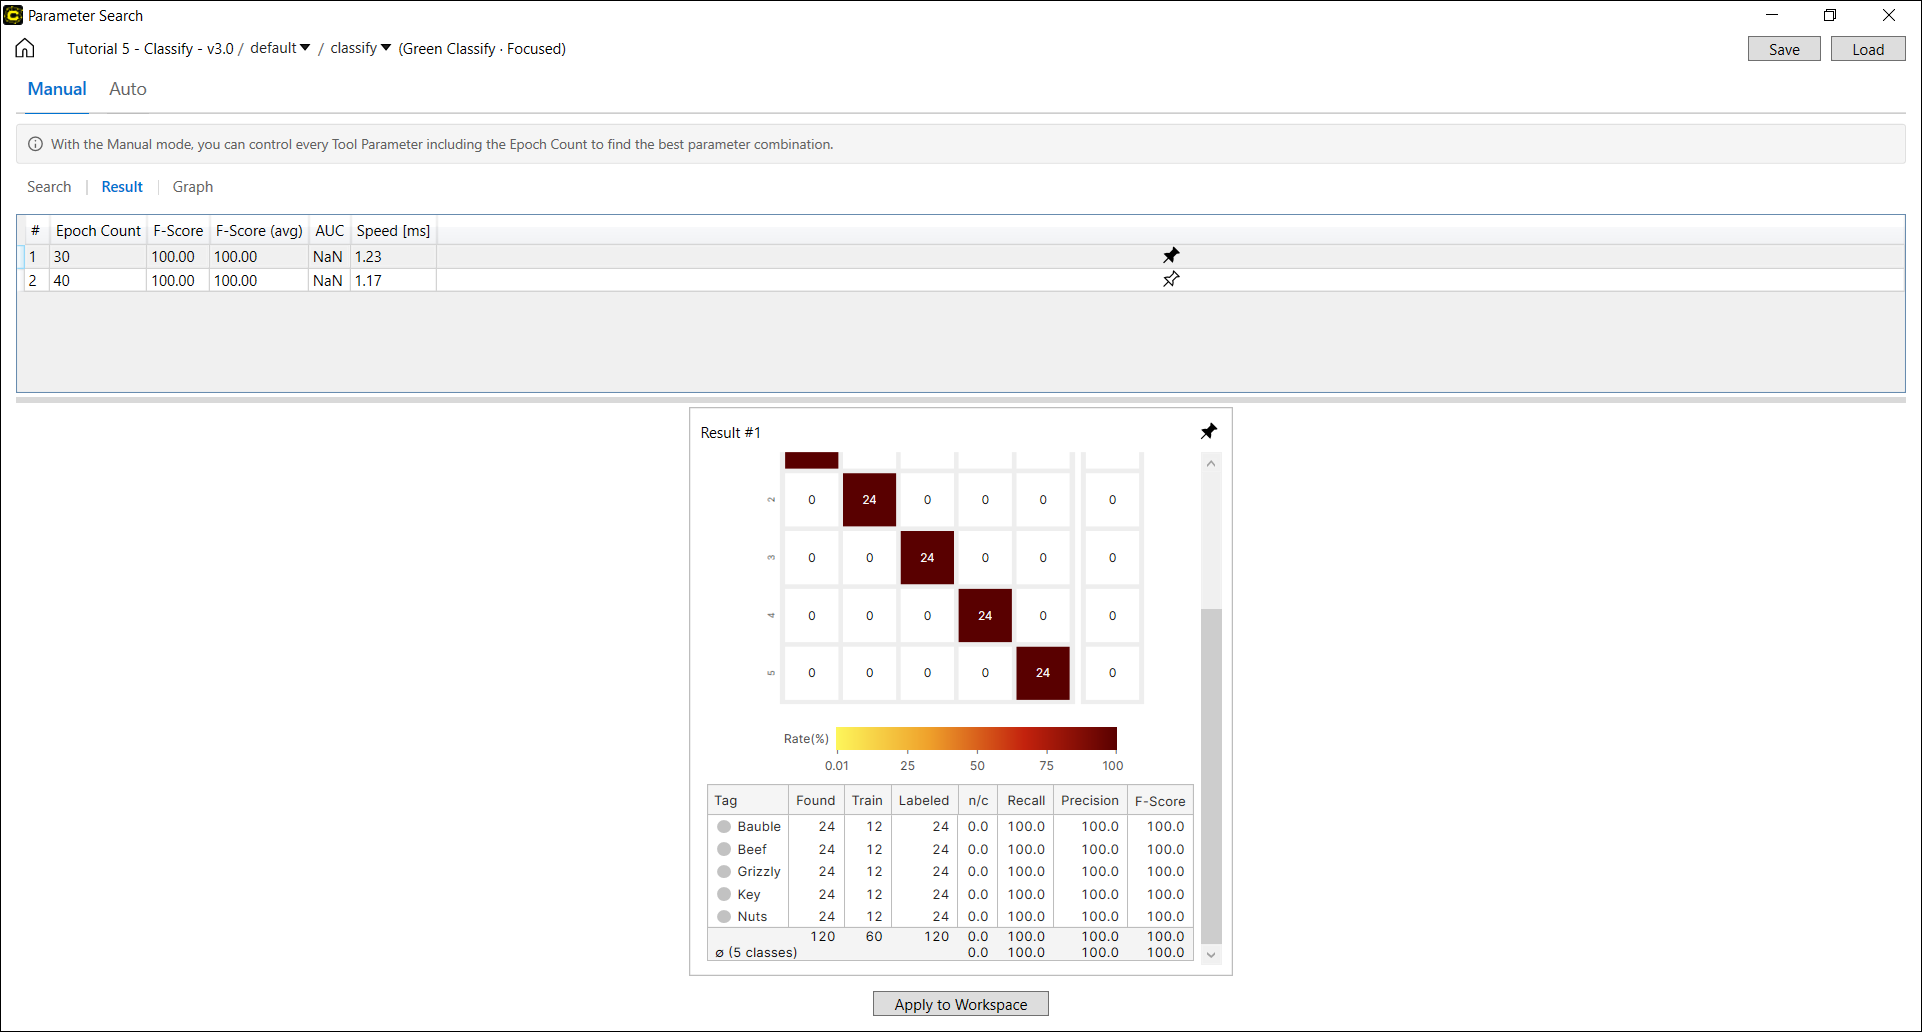
Green Classify Results
The search results of a Green Classify tool includes the classification performance metrics including F-score (avg) and F-score. See Interpret Results for the details. F-score (avg) is the average over the F-scores calculated for each class.
Blue Locate/Blue Read Results
The search results of a Blue Locate/Read tool includes Feature Metrics (the Precision, Recall, F-score calculated per feature) and Model Metrics (the Precision, Recall, F-score calculated per model). See Interpret Results/Interpret Results for the details.
There are other Blue Locate/Read result metrics that are currently only shown in the Parameter Search Utility.
-
Feature Size Difference
-
Feature Angle Difference
-
Feature Position Distance
For Blue Locate/Read, a found feature is said to be correctly found (marked) if there is a labeled feature relatively close. For each correctly found feature, you can compute the position distance, angle difference, and size difference by comparing that correctly found feature to the labeled feature. The reported Feature Position Distance, Feature Angle Difference, and Feature Size Difference in result table are “average feature position distance,” “average angle difference,” and “average size difference” (root-mean-square averages), respectively, calculated over all correctly found features.
| Metrics | Description |
| Feature Size Difference | The difference of Feature Size between the correctly found feature and the labeled feature |
| Feature Angle Difference | The difference of Feature Angle between the correctly found feature and the labeled feature |
| Feature Position Distance | The difference of Feature Position between the correctly found feature and the labeled feature |
Review Workflow
-
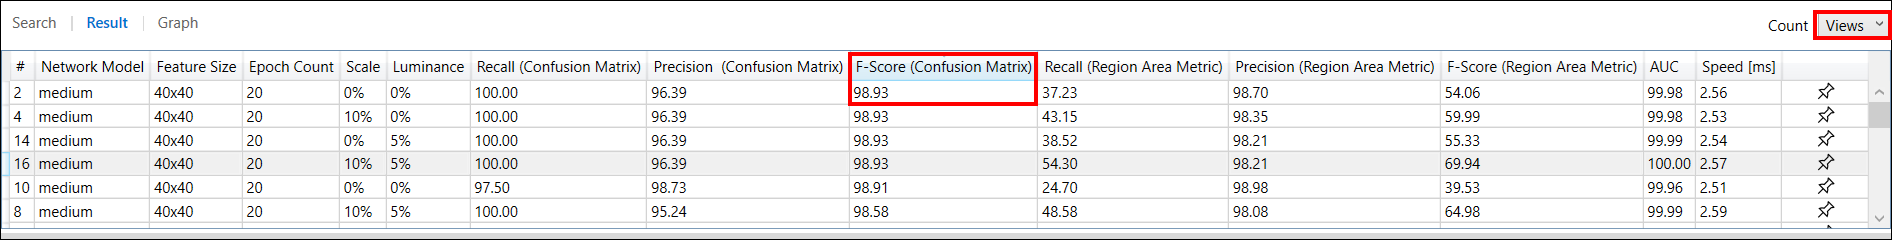
When you click a row in the result table, a row is selected and the Database Overview with a Confusion Matrix corresponds to the search results of this row will show up in the leftmost side at the bottom of the screen. The Database Overview is much the same as the one in Cognex Deep Learning Studio. For Red Analyze tools, Count drop-down options (Views, Untrained Views, Regions, Untrained Regions) can be applied to project the Database Overview by each aspect.
The F-Score of Confusion Matrix When Count is Views
The F-Score of Confusion Matrix When Count is Untrained Views
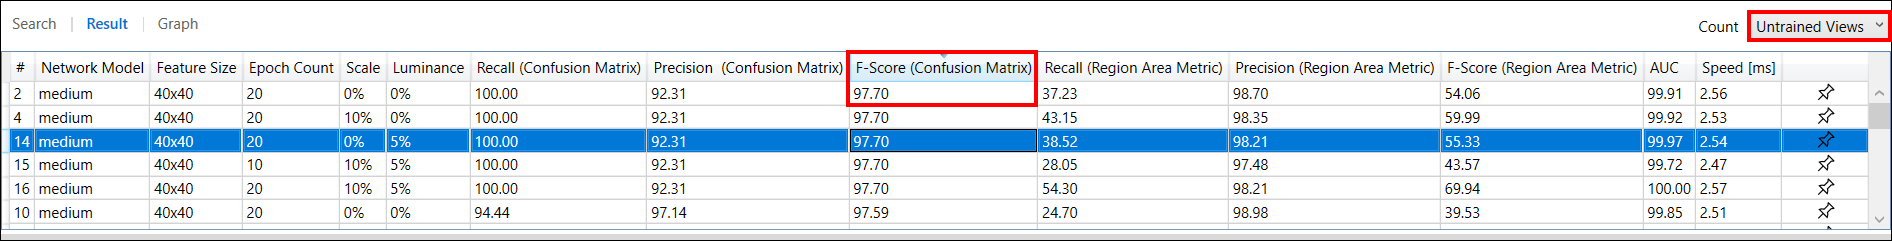 Note: See Confusion Matrix for the details of each option.
 -
Click the Pin
png.png) to pin down the Database Overview for a row. 2 Database Overviews can be fixed at maximum simultaneously. Click
to pin down the Database Overview for a row. 2 Database Overviews can be fixed at maximum simultaneously. Click png.png) icon to release the Database Overview from the panel below.
icon to release the Database Overview from the panel below.-
The Database Overview of every selected row will be pegged down at the leftmost side of the panel below, and 1 or more pinned down Database Overviews will be pegged on its right.
-
If you click
icon on each pegged Database Overview, it will be released from the panel.
-
-
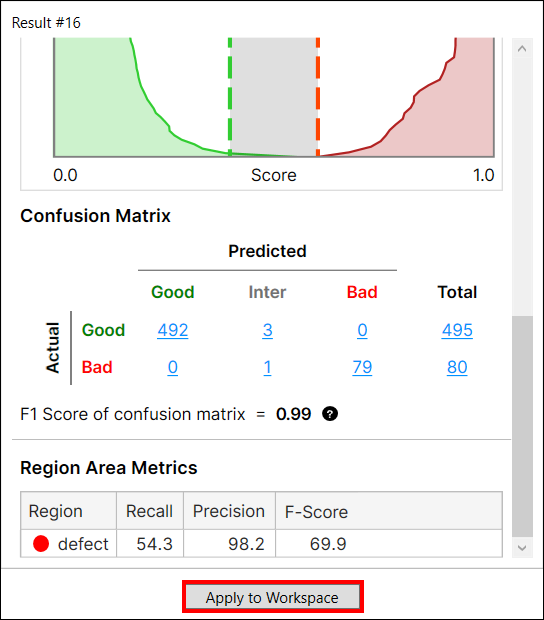
When a row in the result table is selected, click Apply To Workspace to apply the selected parameter set and the trained tool (neural network model) in the loaded workspace. The tool parameter values and the tool itself in the currently loaded workspace will be replaced with those in the selected row in the result table.
After it is applied in the loaded workspace, you now can access the tool and its training results in VisionPro Deep Learning. In Cognex Deep Learning Studio, open the workspace and process the tool and you will get the same results that were produced in Parameter Search.
Note: As the previously saved Parameter Search Data XML file does not contain the trained networks (the trained tools), you cannot use Apply To Workspace with the loaded Parameter Search Data XML file. To apply the previously saved search results to your workspace, you must save the trained networks by enabling Save Tools checkbox in Search page to save tool files that contain the trained networks before beginning a search.Example: Sorting a Red Analyze Focused Supervised Result by F-Score (Region Area Metric) and apply the best result to the current tool, along with the parameter combination (5% Luminance, 10% Scale, 20 Epoch Count) and the trained neural network that produced this result.

Click Apply to Workspace to apply this result to the tool in VisionPro Deep Learning
Example: Launch VisionPro Deep Learning, load the workspace and the tool, and process the tool to review the applied result and the parameter combination.
-
Click Save to export the search configuration and search results as Parameter Search Data XML file. Click Load to import a previously configured and saved Parameter Search Data XML file to the Results page. It can be used as the basis for a new search.
-
Note that the search result table is saved with the Parameter Search Data XML file while the trained networks are not saved with it.
-
-
If you previously enabled Save Tools checkbox in Search page before you start the search, the tools containing the search results are saved after the search. Each saved tool holds the trained neural network model corresponding to each set of parameter values tested.
-
For example, if you have 10 sets of parameters (10 rows in result table), 10 tools will be saved as 10 files to the directory containing the Parameter Search Data XML file.
-
Explore Graphs
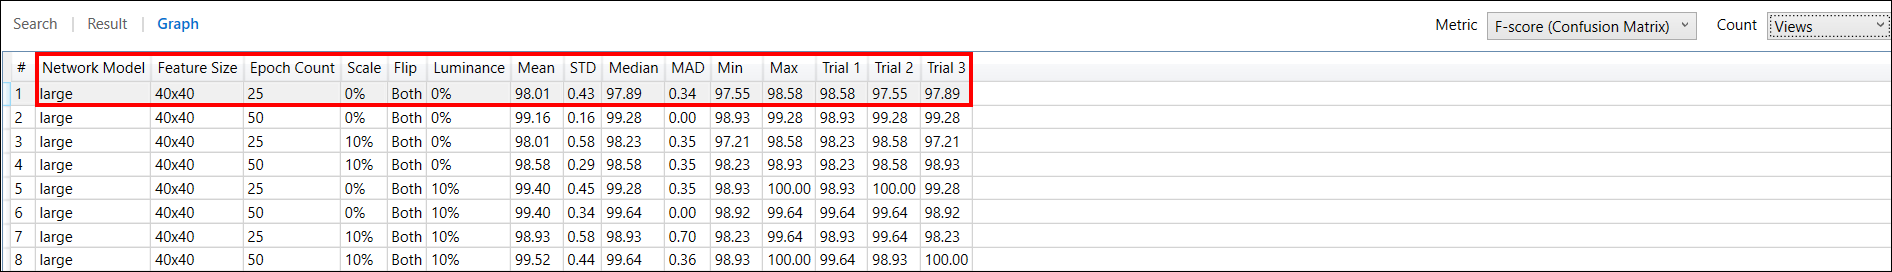
On the Graphs page, the search results are displayed by a result table, which is a little different from the one in the Results page. This table describes the same results, but these results are served using some statistical measures which are calculated over all trials of searching. The Graphs page is only supported for the manual mode.
If the Trial in Search page was set to more than 1, the columns will display the minimum, maximum, mean, standard deviation, median, median absolute deviation of the chosen metric at the Metric drop-down list over all trials, given these values of parameters. For example, let us assume the following search configuration is given:
-
Tool: Red Analyze Focused Supervised
-
Parameter Set: Luminance, Scale, Epoch Count
-
Parameter Range
-
Luminance: 0%, 10%
-
Scale: 0%, 10%
-
Epoch Count: 25, 50
-
-
Trial: 3
If the Luminance, Scale, Epoch Count values at the first row of the result table are {Luminance: 0%, Scale 0%, Epoch Count: 25} and if you set the performance metric as F-Score of Confusion Matrix at the Metric drop-down list, the result table will display the minimum, maximum, mean, standard deviation, median, median absolute deviation of F-Score of Confusion Matrix over 3 trials when Luminance is 0%, Scale is 0%, and Epoch Count is 25, at its first low. See Confusion Matrix for the details of F-Score of Confusion Matrix.
In addition to this, 2D contour plots that describe 3 or more variables (dimensions) and depict the search results are given. Especially, these graphs illustrate the relationships between the chosen parameters in terms of the statistical search results over all trials.
To plot the search results on the graph, you first set the x-axis and y-axis of the graph from the parameters used in the search. Set the desired parameters as x-axis and y axis, respectively, using the drop-down lists for each parameter.
Once the 2 axes are set, you are ready to see how the value of a performance metric variates by the values of 2 axes. The numeric values plotted on the graph are basically the values of each performance metric turning up as you scroll through the Metric drop-down list. Plus, in Measure drop-down list, you need to select a statistical measure which is calculated over all trials for the selected metric. The list of the supported measures in the Measure drop-down list is as follows:
-
Mean: the mean of the metric over all search trials
-
STD: the standard deviation of the metric over all search trials
-
MAD: the median absolute deviation of the metric over all search trials
-
Median: the median of the metric over all search trials
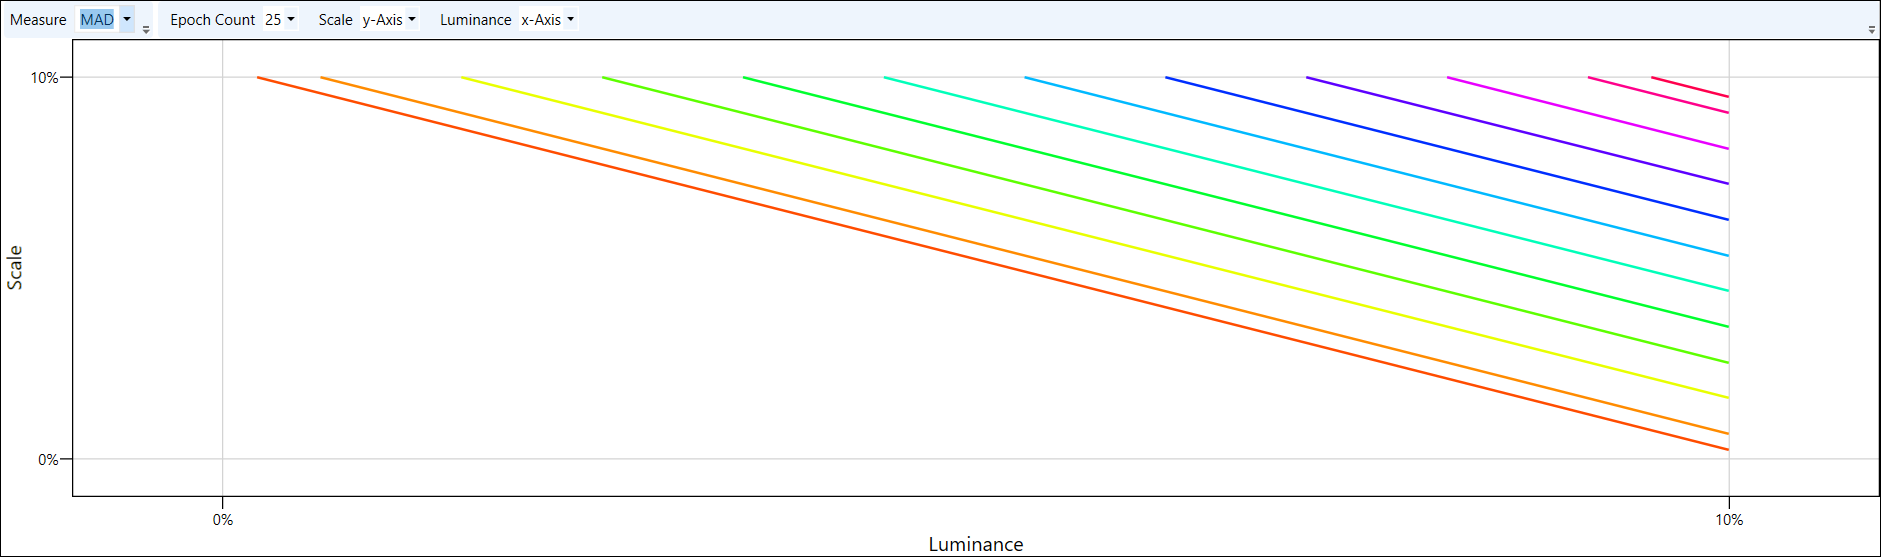
Choose MAD as the Statistical Measure
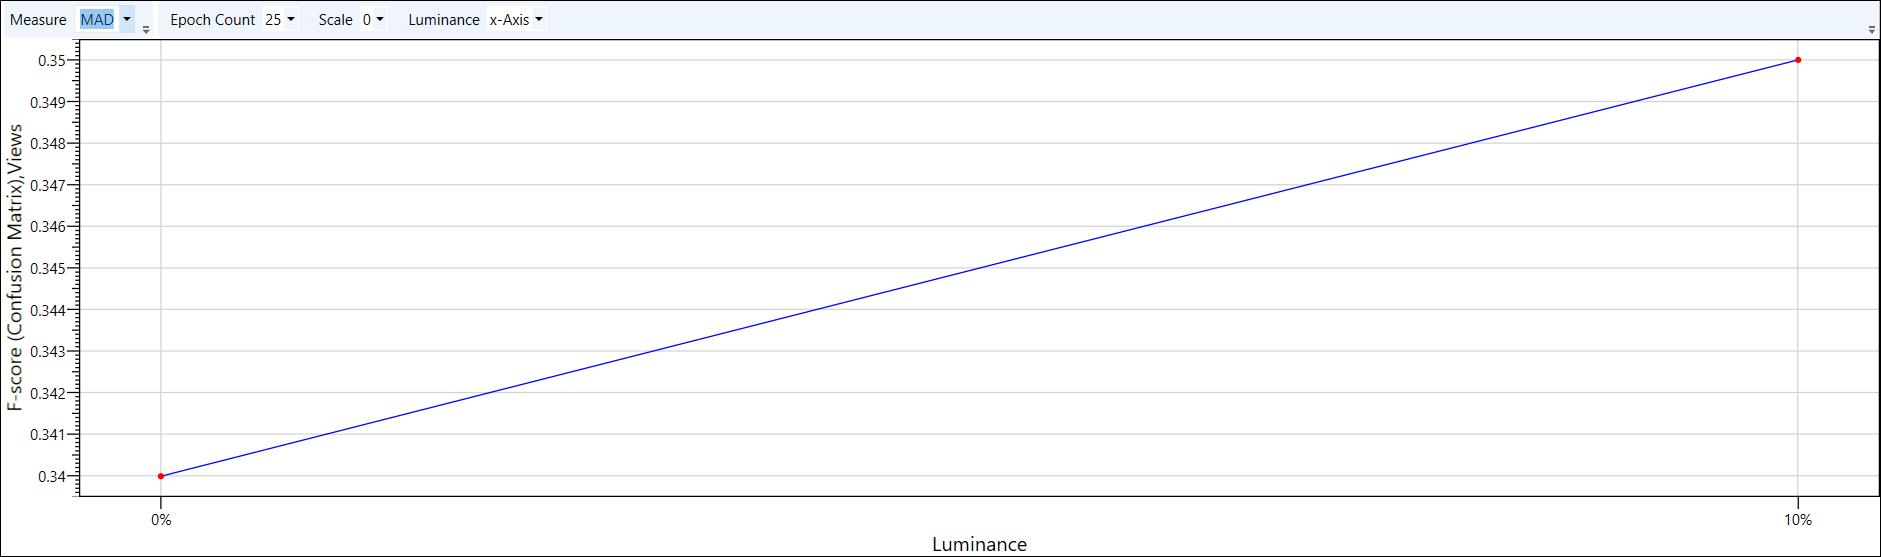
For example, if you set Luminance as x-axis, set Scale as y-axis, select F-Score in Metric, and select MAD in Measure, the MAD values of F-Score over all trials will be plotted on the graph following the changes of Luminance (x-axis) and Scale (y-axis) values.
If there are 3 or more parameters, the parameters for x-axis and y-axis can be swapped over among them. The values of parameters other than x-axis and y-axis can also be projected on the graph by selecting the specific values for each parameter's drop-down list.
Exploration Workflow
-
Select F-Score in the Metric drop-down list, and this will show the result table for F-Score just below. The columns display the values of parameters and the mean, standard deviation, median, median absolute deviation, minimum, and maximum of F-Score over all trials, given these values of parameters.
-
For Red Analyze tools if you chose Confusion Matrix metrics in Metric drop-down list, Count drop-down (Views, Untrained Views, Regions, Untrained Regions) can be applied to project the graph by each aspect. See Confusion Matrix for the details of each option.
-
For Blue Locate/Read tools if you chose Precision, Recall, and F-Score in Metric drop-down list, Count drop-down (Features, Model) can be applied to project the Precision, Recall, F-Score for Features or the Precision, Recall, F-Score for Models on the graph. See Interpret Results/Interpret Results for the details.
-
-
Provide a measure (mean, standard deviation, median, or median absolute deviation) at the Measure drop-down list, and set the parameters for the x-axis and y-axis.
- If you previously set more than 1 trial at Trials bar on Search page, there will be many columns where correspond to the F-Scores of each trial (Trial 1, Trial 2, Trial 3, ... , Trial N). The chosen measure for a metric is calculated over all trials.
- Note that when it was tested with only 1 Trial, the results will not be returned for STD, MAD, Min or Max.
-
Set the values for the parameters other than x-axis and y-axis at each drop-down list. Then, the corresponding contour plot will show up.
-
If you have finished investigating the result table and the graphs, and found the one best set of parameter values, you can go back to the Results page, select a row that describes the best set found in the result table, and click Apply To Workspace to apply the selected set and the trained tool (neural network model) in the loaded workspace. The tool parameter values and the tool itself in the currently loaded workspace will be replaced with those in the selected row in the result table.