Supervised Mode – Image Results
While in Supervised Mode, image results are displayed via the following mechanism:
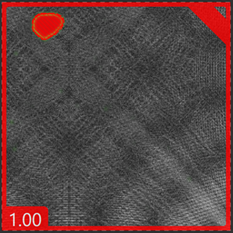
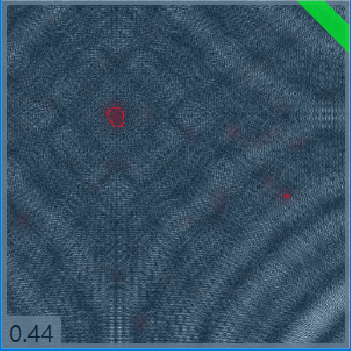
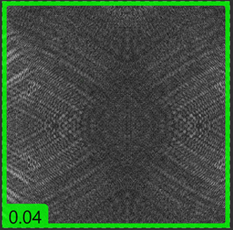
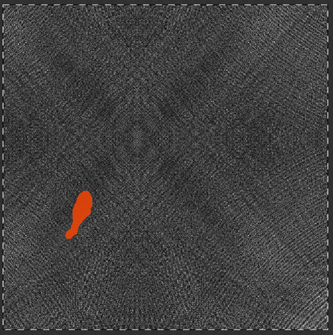
| Image with defects | Middle score image | Defect-free image |
|---|---|---|
|
|
|
|
|
Images with a high score and a red border indicate that there is a defect(s). The defect will be indicated with a red area outline. |
Images that return a middle score will have a grey border, and may require further adjustment of the tool's parameters. |
Images with a low score and green border indicate that there are no defects detected. |
One method for compensating for middle score images is to adjust the tool's Score thresholds to allow for either higher or lower scores to properly classify the images. However, this method only works if there is a gap between the good and bad images classification. If there is no gap, the tool would be classifying more images as false results.
Region List
The region list is the table displayed on the bottom of Image Display Area that shows the information of each defect region. It consists of 2 tables, each holds the information for the labeled defect region (the defect region you labeled) and the marked defect region (the predicted defect region as the result of processing). Each row in a table represents information of each defect region.
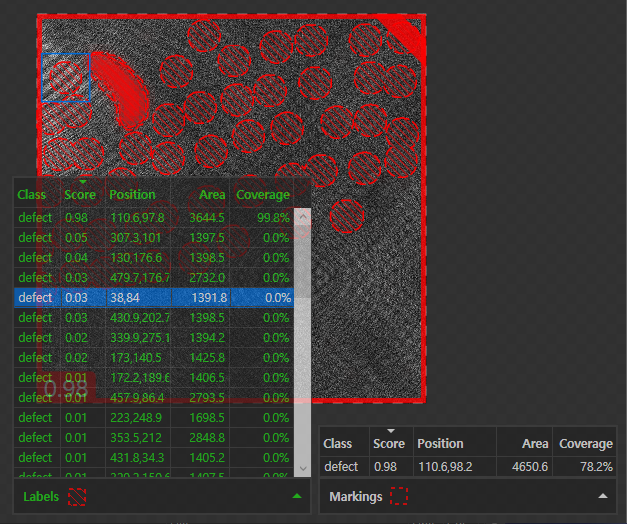
For each table, you can click a row to highlight its information both in the table and Image Display Area.
| Column | Description |
|---|---|
|
Score |
The highest defect probability among the defect probabilities of each pixel in the defect region, as the result of processing. For the Labels table, this represents the highest defect probability for a region that was labeled as a defect region. For the Markings table, this represents the highest defect probability for a region that was predicted as a defect region. |
|
Position |
The x, y coordinate of the center of the defect region. |
| Area | The number of pixels in the defect region. |
|
Coverage |
The overlapping ratio between the labeled defect region and the predicted (marked) defect region. |
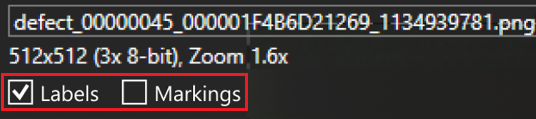
Overlay Checkbox
The 2 tables above are shown back and forth or side by side, with the overlay graphics of labels and markings, whenever you press Alt + Left/Right or enable each checkbox (Labels and Markings) on Image File Information.
Fine-tuning
Adding more labels and readjusting the training image set is another method to compensate for middle score images.
In this scenario:
-
Identify an image with a middle score that does not appear to be properly marked.
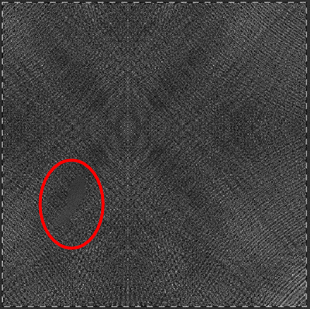
- Make sure that the image is improperly marked. In this example, in the above image, the overlay markings have been hidden (by pressing Alt+Arrow key), indicating that the defect area was improperly drawn.
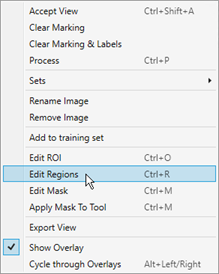
- Accept the view in order to retain the area already marked as a bad region.
-
Edit the Region.
-
Properly fill in the defective region.
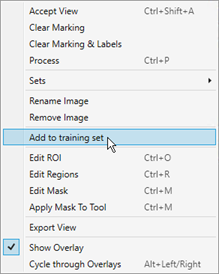
-
Optionally, if the tool is having difficulty with this particular image, you can add the image to the list of images that are always used when training.