Diagnostic Displays
When you train and run PatMax you have the option to provide a diagnostic object (ccDiagObject) and a set of flags. The flags you set cause PatMax to save diagnostic information in the diagnostic object during execution. Later you can run a diagnostic utility to observe the diagnostics for troubleshooting and evaluating your application. PatMax can save detailed information about training, the run-time image, and the results. Be aware that computing and retaining this information increases memory usage and makes your application run slower.
The diagnostic flags are described in the ccPMAlignPattern reference page and defined in ccDiagDefs. See dFlags in ccPMAlignPattern::train() and ccPMAlignPattern::run(). To cause diagnostic information to be saved add code similar to the following to your application initialization:
ccDiagObject diagObj;
c_UInt32 diagFlags=ccDiagDefs::eRecordDefault;
This code creates a diagnostic object and sets diagnostic flags that enable recording tool inputs and final results.
To observe recorded diagnostics add the following code to your application somewhere after running PatMax:
ccDiagServer::init() //Initialize the server thread
ccDiagServer::showDaigObject() //Display the diagnostics
ccDiagServer::exit() //End the thread
To demonstrate the use of diagnostic displays we have added the code described above to the pmalign2.cpp sample code included with your CVL release. The table below summarizes how the sample code operates before it is modified to display diagnostics.
|
Program steps |
Display windows |
Control windows |
|
1. Create a run-time image containing three target patterns |
|
|
|
2. Create a training image containing a square wireframe pattern |
|
|
|
3. Train the tool |
Trained Patquick Pattern Trained Patquick Pattern |
Model Trained Features |
|
4. Run the tool |
Cognex Standard Output Found PatQuick Pattern |
Results |
|
5. End the program |
|
cvlproj |
pmalign2.cpp sample code operation
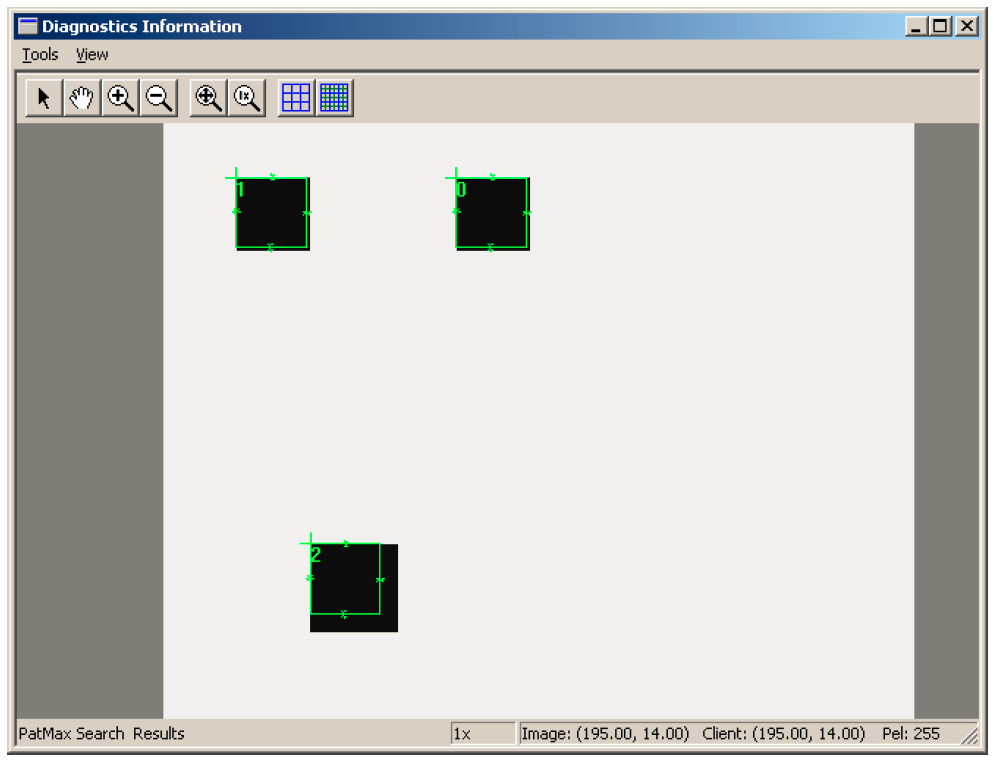
The figure below shows the graphic results which display the input image with the trained pattern overlaid onto each found pattern instance. The results are labeled 0, 1, and 2.
To add diagnostic displays to this sample program we need only change one line of code from -
c_UInt32 diagFlags=0;
to -
c_UInt32 diagFlags=ccDiagDefs::eRecordDefault;
Other required code mentioned above is already part of pmalign.cpp.
When we recompile and rerun the program it now functions as show in the table below. Note that the operation is the same as before until Step 4 when we run the tool.
|
Program steps |
Display windows |
Control windows |
|
1. Create a run-time image containing three target patterns |
|
|
|
2. Create a training image containing a square wireframe pattern |
|
|
|
3. Train the tool |
Trained Patquick Pattern Trained Patquick Pattern |
Model Trained Features |
|
4. Run the tool |
Cognex Standard Output Diagnostics Information Diagnostics Details |
Diagnostics |
|
5. End the program |
|
cvlproj |
pmalign2.cpp sample code operation
Two new windows now appear in Step 4; Diagnostics Information and Diagnostics Details. The left-hand panel in the Diagnostics Details window contains the directory of the stored diagnostic information. When you select an item from the hierarchy, stored text information about that item is displayed in the right-hand panel and stored graphics diagnostics are displayed in the Diagnostics Information window. The default display is shown in the figure below which displays the run-time results (PatMax Search Results).
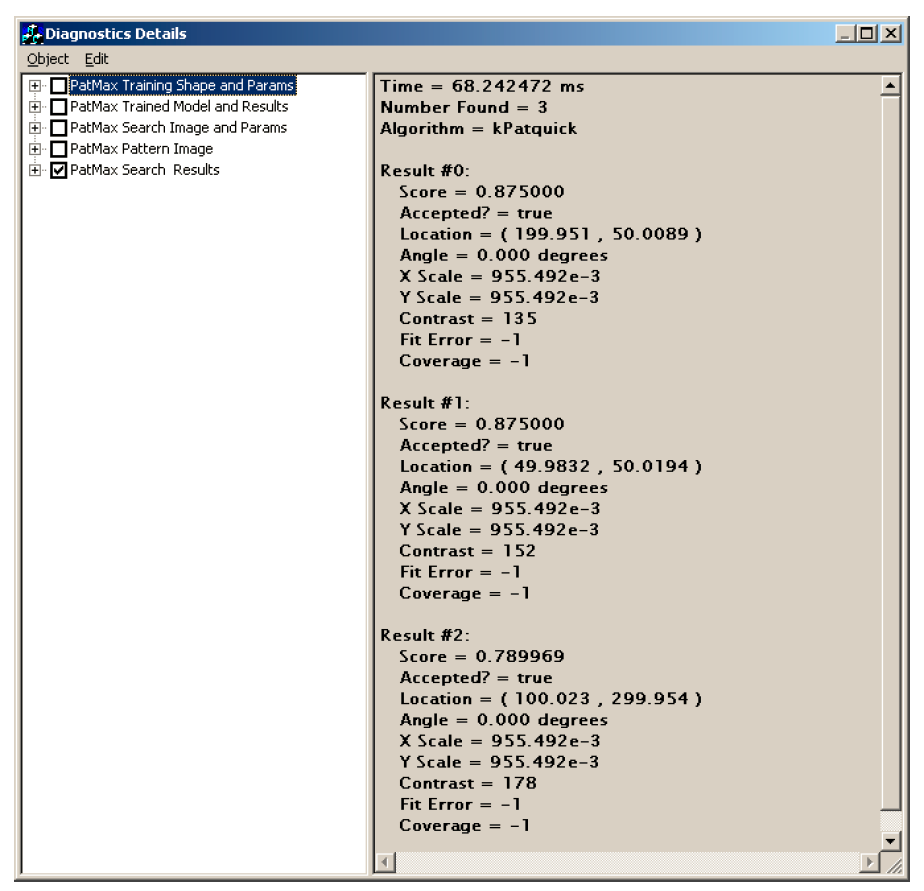
Diagnostic run-time results display
You click on the + and - boxes to open and close the hierarchy, and you click on the adjacent detail boxes to display the detail information. For this example, we used the default diagnostic flags which include the following:
eRecordDefault = eInputs | eResults | eRecordOn;
This causes the tool to save diagnostic information for the inputs and the results. In the Diagnostic Details display above the inputs are included under the first four boxes and the results are included under the last box. Intermediate results can also be saved by setting the eIntermediate flag which we did not include in this example. The figure below shows the complete diagnostics hierarchy.
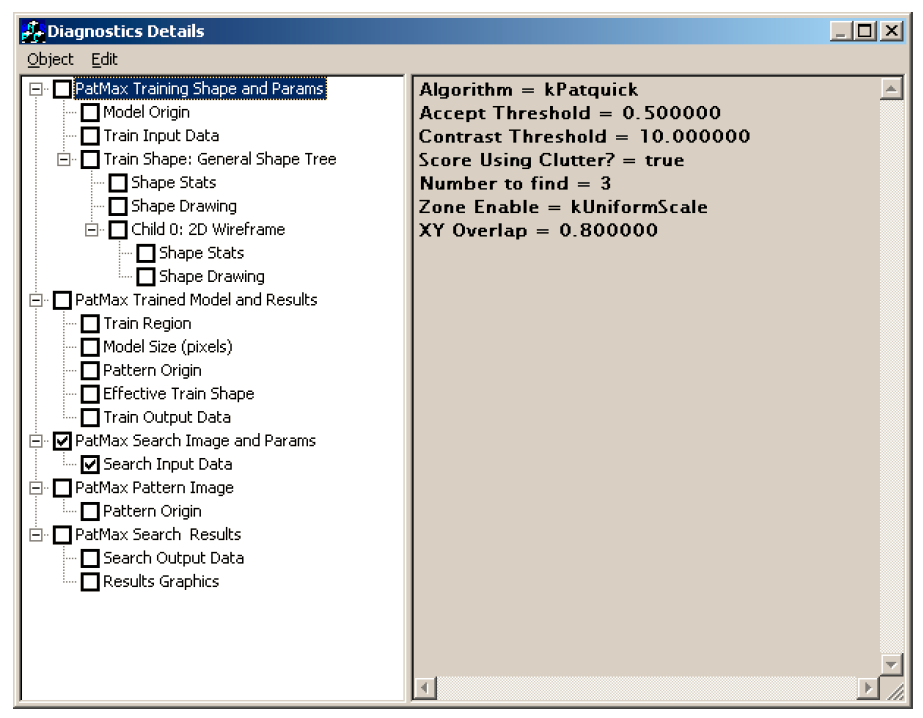
Complete diagnostics hierarchy