Performance Overview
The Performance Overview page of the RTM app provides the performance data from time intervals older than 24 hours. In Performance Overview Edge Intelligence can track a number of trigger statistics from the selected group of DataMan readers, and visualize the data in various ways. It displays the data collected in trackers arranged to performance over time, throughput over time and an adjustable tracker at the bottom of the page. Trackers provide detailed information about each event. To see details of an event, hover the mouse over the tracker. To zoom in, use the slides above the trackers. To returned to the selected time range, click Show all.
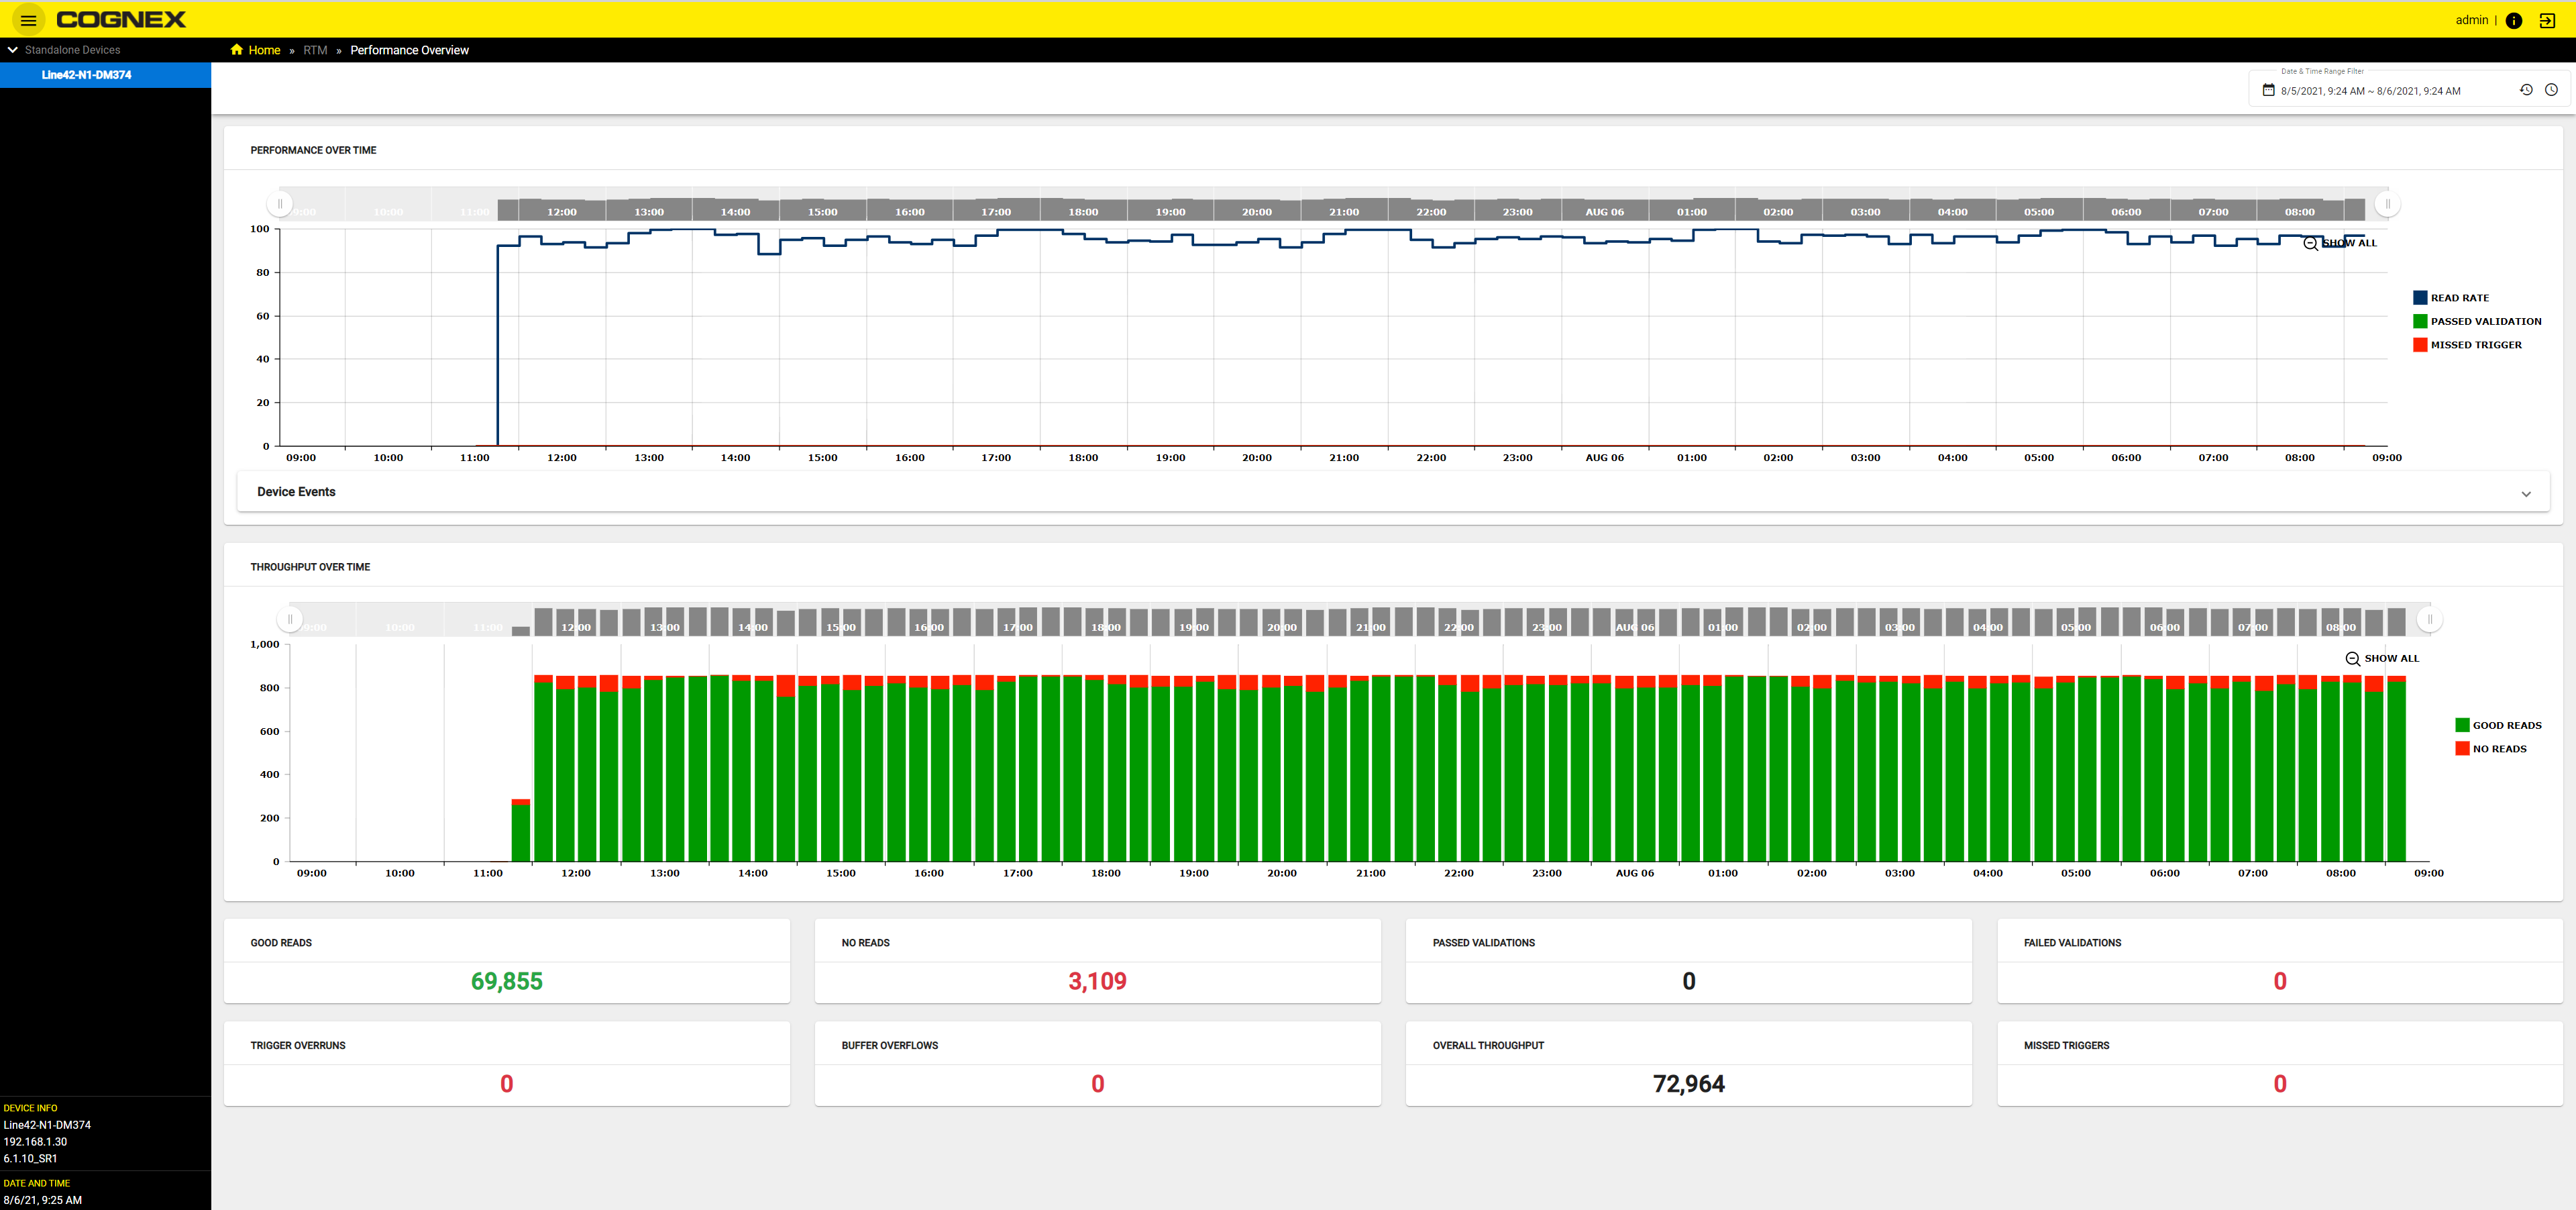
To select a standalone reader or group, click on the name in the device tree.
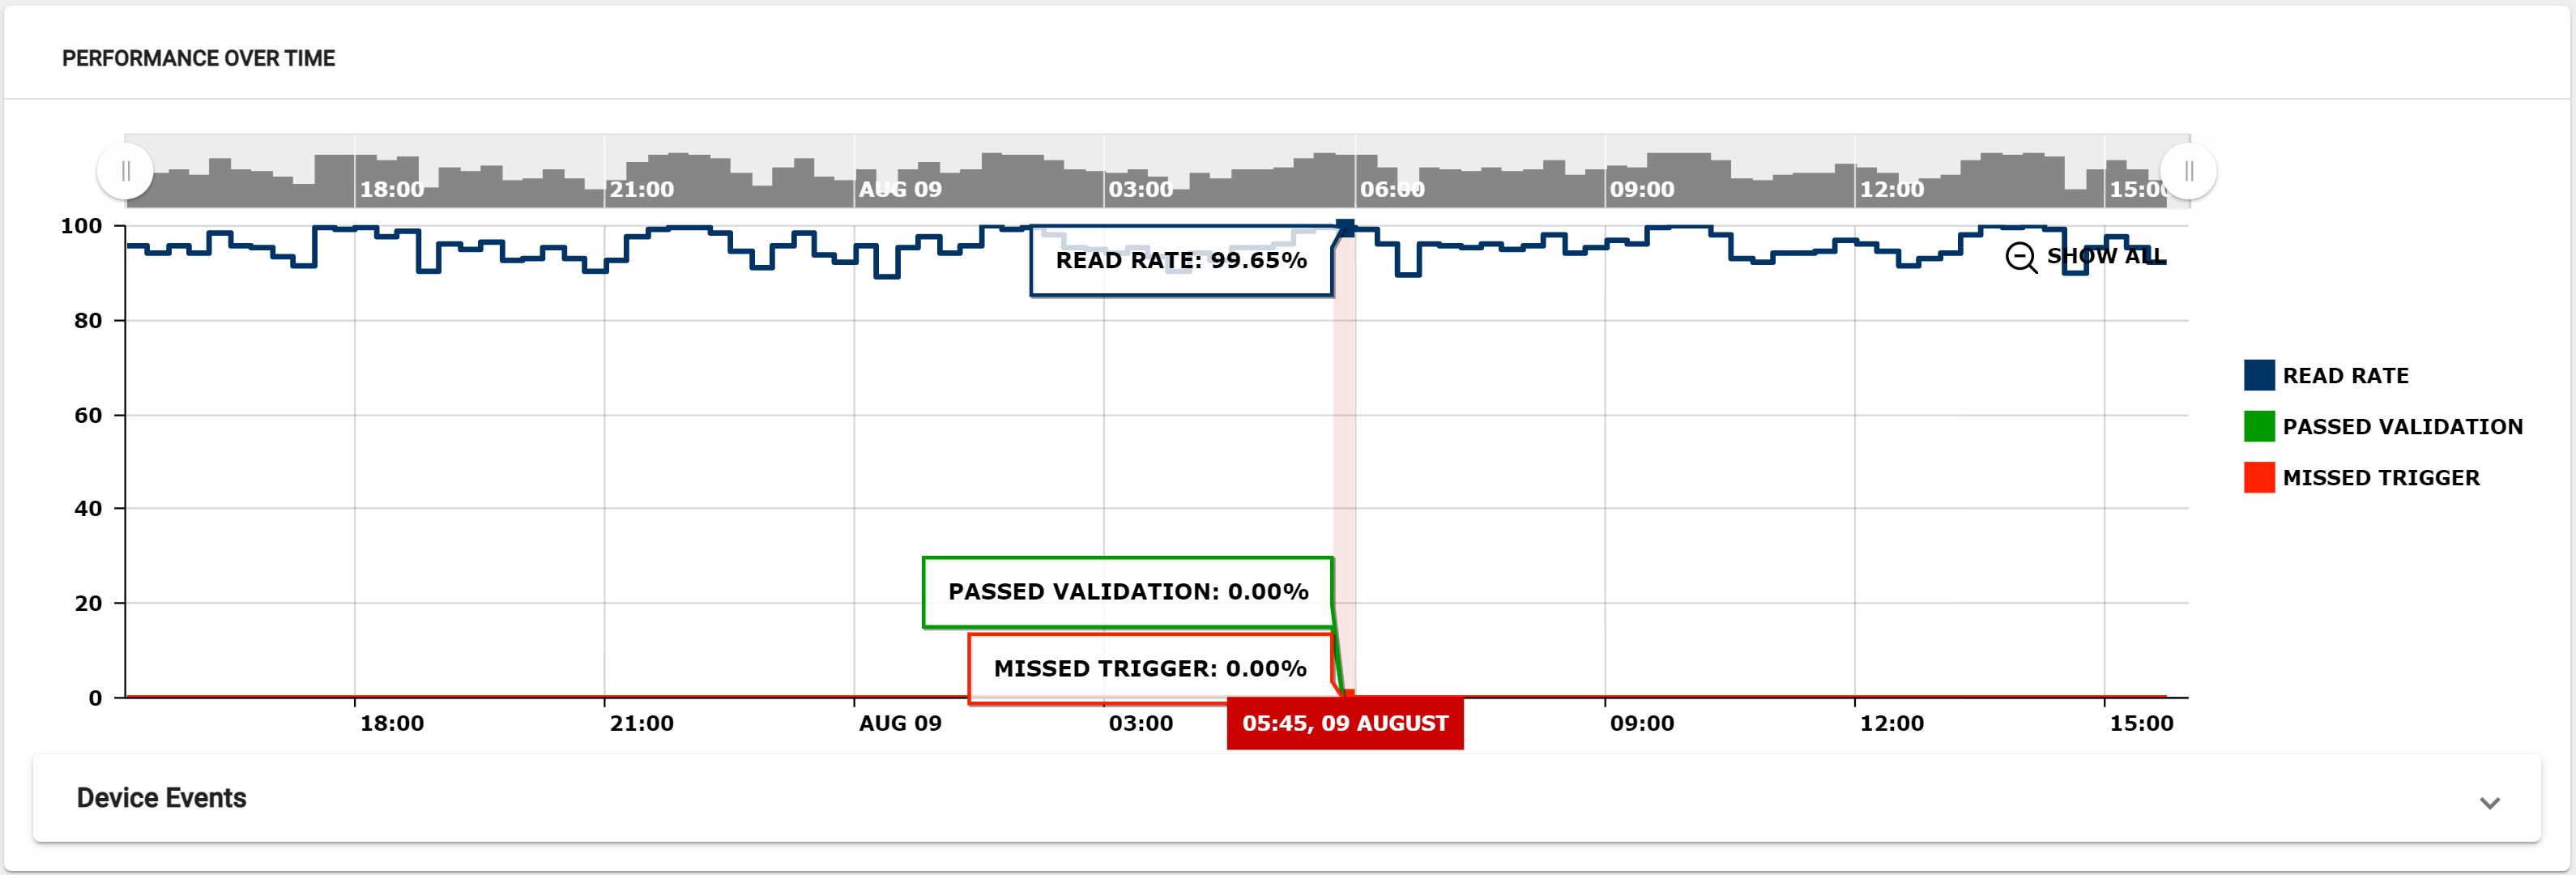
Performance Over Time
The Performance Over Time section shows color coded performance data in the selected range of time.
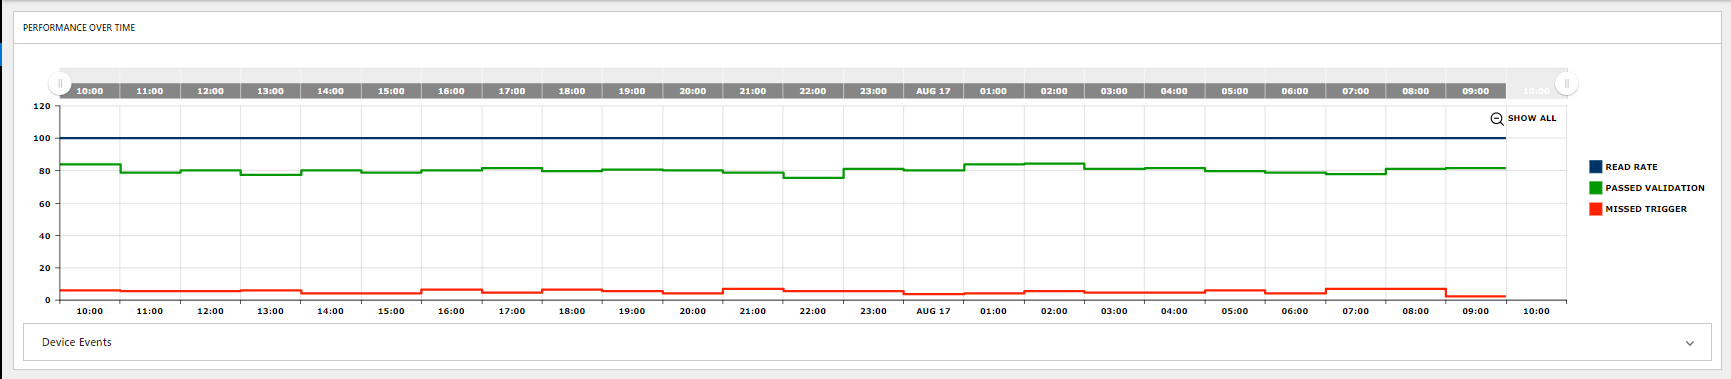
- Read Rate shows the rate of good reads compared to the number of total triggers.
- Passed Validation shows the rate of passed validations compared to the number of total triggers.
- Missed Trigger shows the rate of missed triggers compared to the number of total triggers.
To see the percentage of Read rate, Passed Validation, and Missed Triggers hover the mouse over the tracker. To take a more detailed look over a certain part in the time range given, drag the slides above the tracker. To return to the overview, click on Show all.
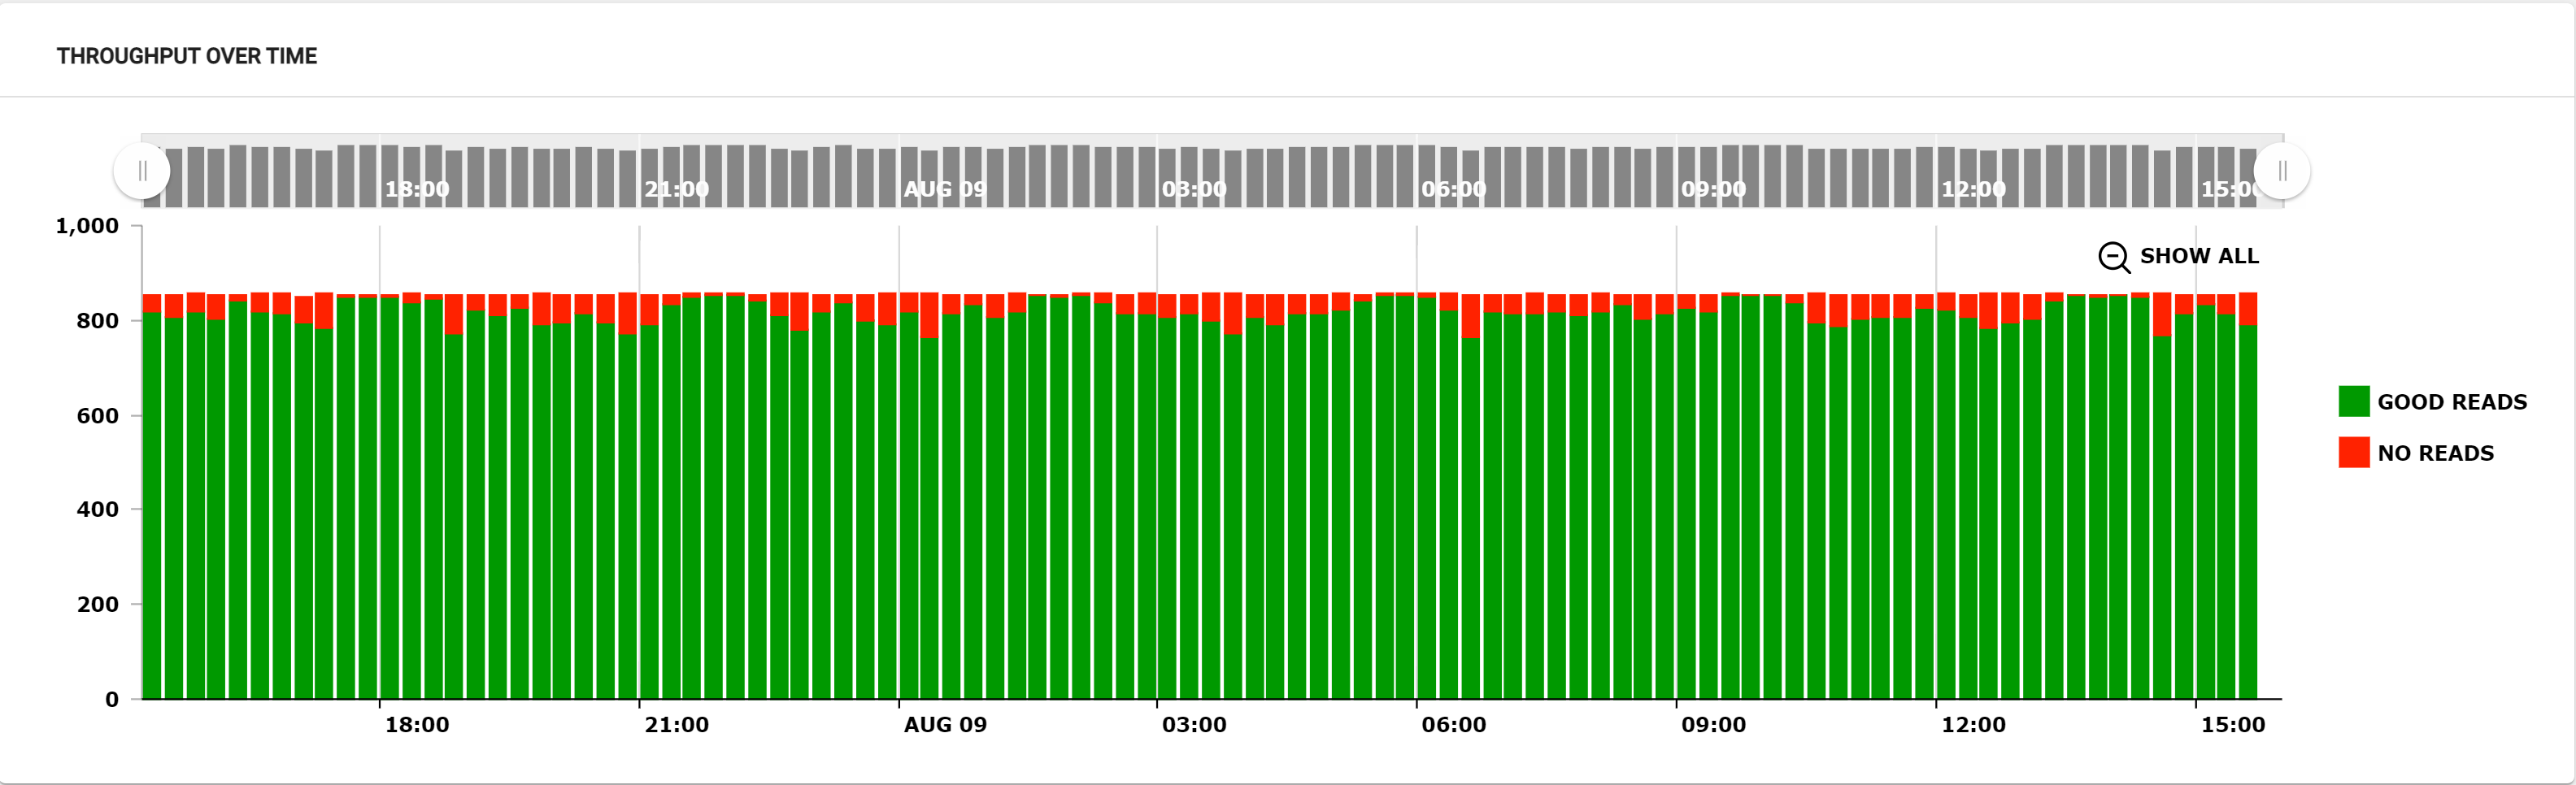
Throughput Over Time
The tracker is dynamic chart that sums up throughput over the given time range. The data shown in the chart is color coded: GREEN stands for Good reads, and RED for No reads.
To see the number of Good Reads or No reads hover the mouse over the tracker. To take a more detailed look over a certain part in the time range given, drag the slides above the tracker. To return to the overview, click on Show all.
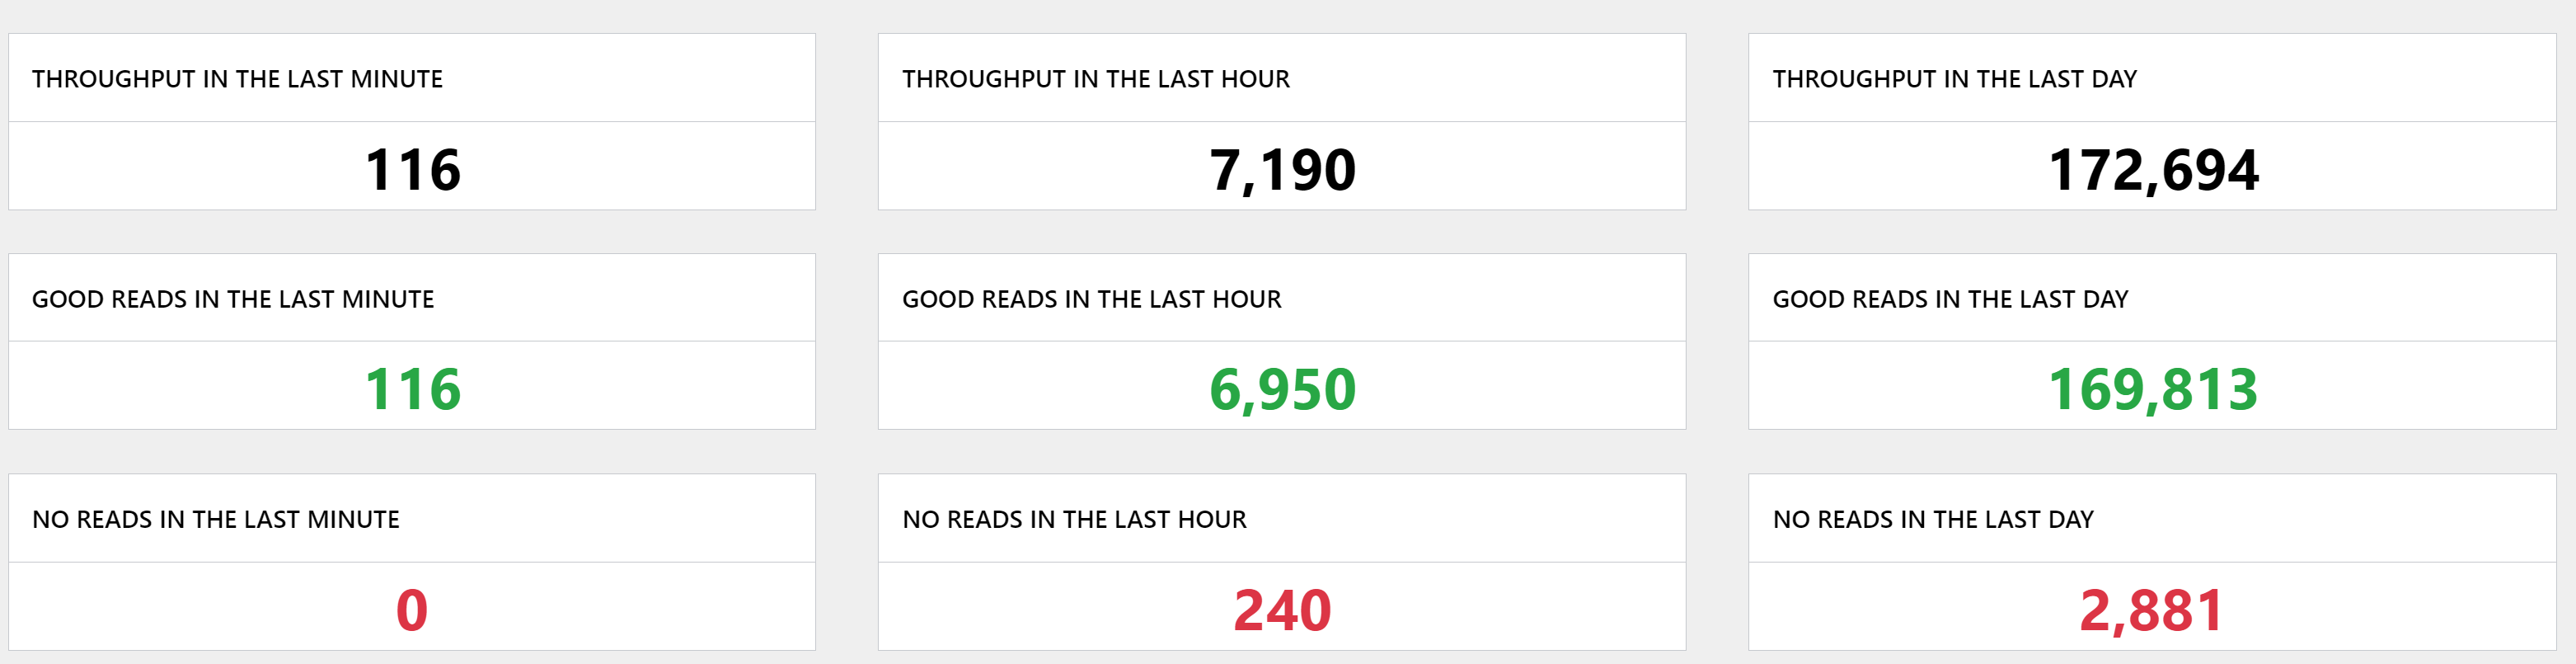
Overall reader statistics
Counters provide statistical data separated into categories of the overall read rate pertaining to the given time range. The Counters are color coded to give the user an at-a-glance overview of the performance of the group or standalone reader.
The dashboard also displays counters for:
- Good Reads – The number of triggers where a code was successfully decoded.
- No Reads – The number of triggers where a code was not decoded.
- Passed Validations – The number of good reads whose encoded data passes a specified content, format, or quality standard.
- Failed Validations – The number of good reads whose encoded data does not pass a specified content, format, or quality standard.
- Trigger Overruns – The number of times that the image could not be acquired because the reader was busy (for example, due to an ongoing burst or a long exposure).
- Buffer Overflows – The number of times it was possible to acquire an image, but there is no space left to save it on the reader. In other words, images are acquired faster than they can be processed. One possible situation is when decoding takes longer than what the image/trigger interval is.
- Overall Throughput – The sum of good reads and no reads.
- Missed Triggers – The sum of trigger overruns and buffer overflows.