Metrics
The Metrics tab consists of a confusion matrix and a table view of the results.
Confusion Matrix
The confusion matrix is a table that compares the predicted values to actual applied labels. Each row in the matrix shows the number of features you labeled, which is the ground truth. Each column shows the number of features the tool has predicted.
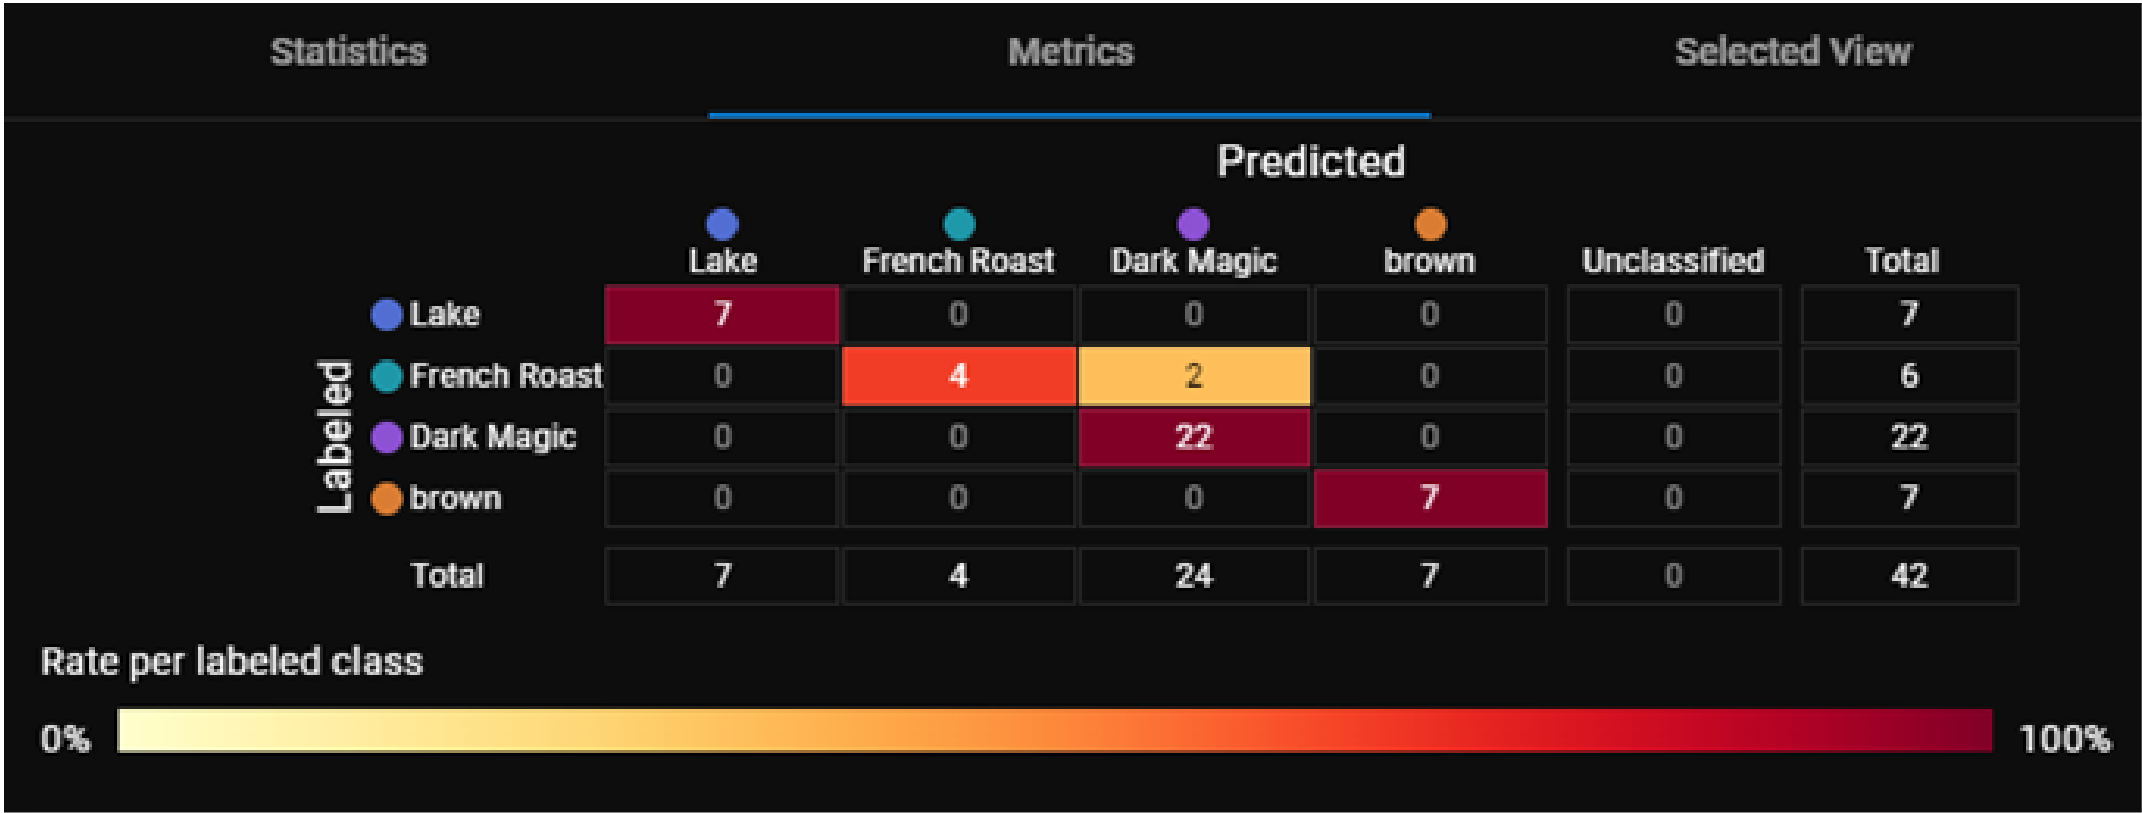
The color scheme of the confusion matrix provides a quick way for you to see the distribution of the views in the matrix.
The color of a cell is the ratio of predicted features to the total number of labeled features per class. A darker color means a higher ratio and a lighter color means a lower ratio.
For example, the cell for features labeled as Dark Magic and predicted as Dark Magic contains the number 22. This cell is dark red because 22 is 100% of the total number of features labeled as Dark Magic. The cell for features labeled as French Roast and predicted as French Roast contains the number 4. This cell is a lighter red because 4 is only 66% of the 6 total features labeled as French Roast.
A diagonal line of dark cells in the confusion matrix shows that the tools predictions are matching the expected labels.
You can use the confusion matrix to identify the input views that produced specific results by clicking on one or more cells. This filters the images in the image manager and applies a blue border around the column, indicating the filtered status.
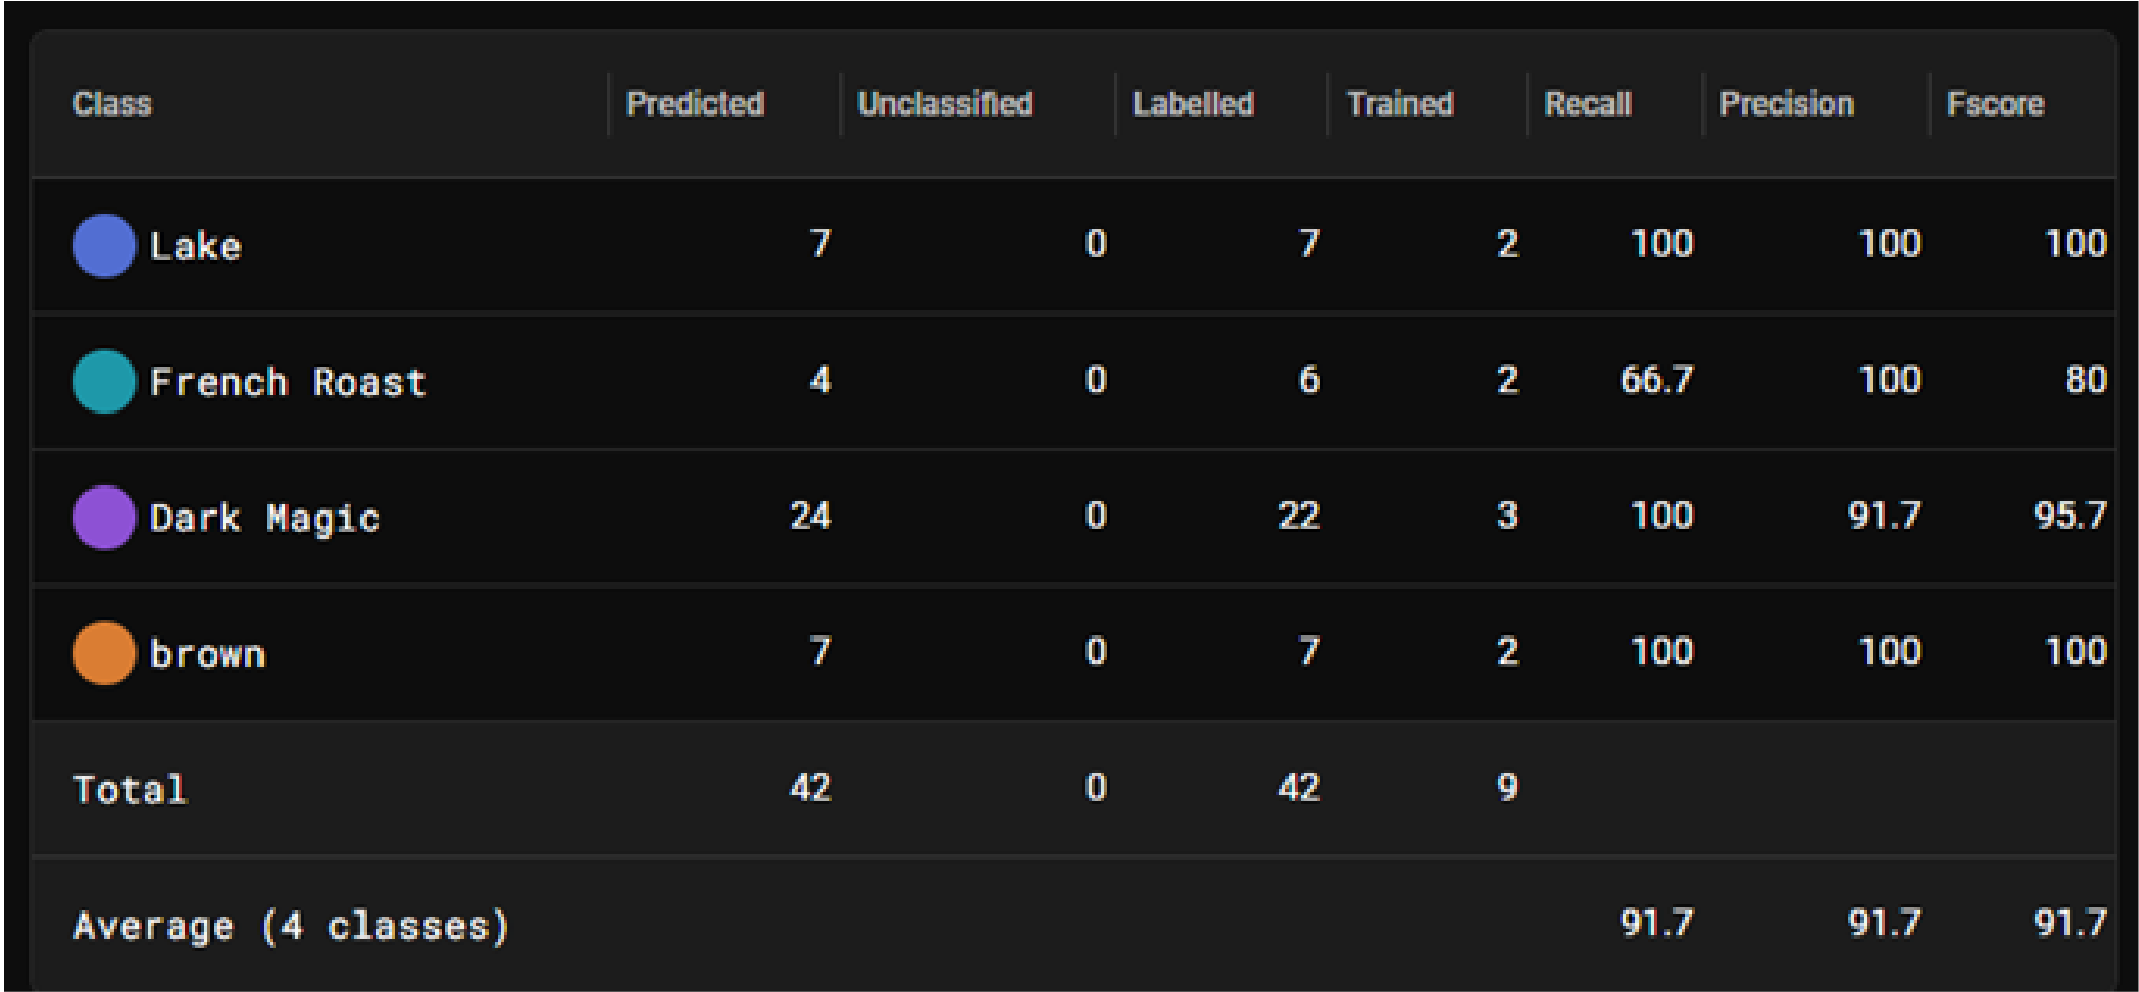
Table View
The Table view provides detailed metrics about each feature class.
|
|
|
| Column | Description |
| Class | Name of the feature class. |
| Predicted |
Number of features the tool predicted as this class when processing all views. |
| Unclassified | Number of features the tool did not classify. |
| Labeled |
Number of features in this feature class included in all views. |
| Trained |
Number of features in this feature class included in the training set. |
| Recall |
Percentage of labeled features or classes that the tool correctly identified. |
| Precision |
Percentage of detected features or classes that match the labeled feature or class. |
| F-Score |
Represents the overall accuracy of the tool. F-Score is the harmonic mean of the Recall and Precision scores, which provides a single metric that balances both Precision and Recall. The value of the F-score is between 0 to 1, with 1 being a better score. |